Peruvian vs Immigrants from Jordan Median Household Income
COMPARE
Peruvian
Immigrants from Jordan
Median Household Income
Median Household Income Comparison
Peruvians
Immigrants from Jordan
$90,261
MEDIAN HOUSEHOLD INCOME
96.5/ 100
METRIC RATING
113th/ 347
METRIC RANK
$89,412
MEDIAN HOUSEHOLD INCOME
94.1/ 100
METRIC RATING
124th/ 347
METRIC RANK
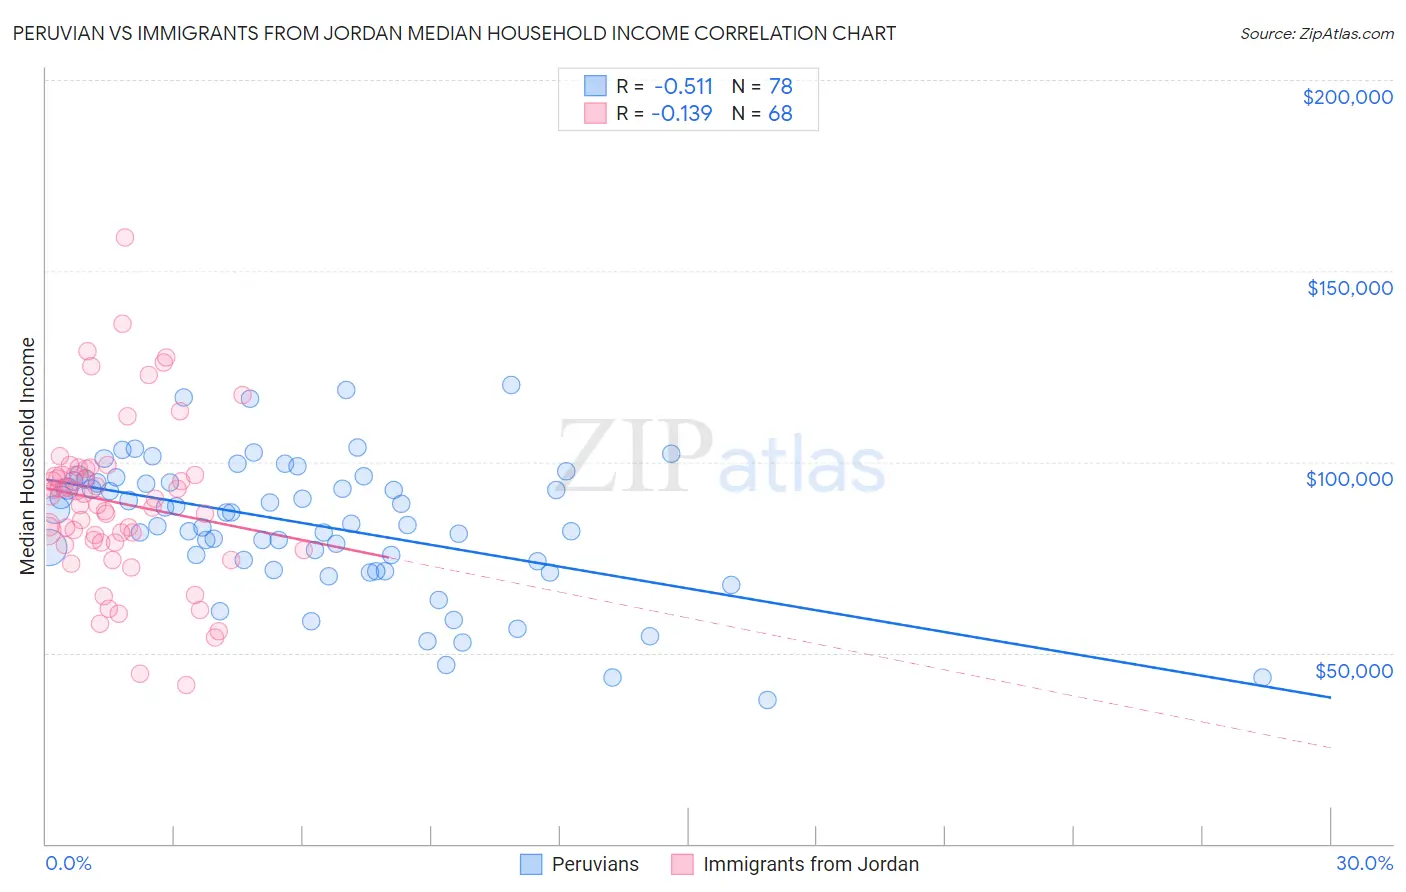
Peruvian vs Immigrants from Jordan Median Household Income Correlation Chart
The statistical analysis conducted on geographies consisting of 362,893,410 people shows a substantial negative correlation between the proportion of Peruvians and median household income in the United States with a correlation coefficient (R) of -0.511 and weighted average of $90,261. Similarly, the statistical analysis conducted on geographies consisting of 181,227,500 people shows a poor negative correlation between the proportion of Immigrants from Jordan and median household income in the United States with a correlation coefficient (R) of -0.139 and weighted average of $89,412, a difference of 0.95%.
Median Household Income Correlation Summary
| Measurement | Peruvian | Immigrants from Jordan |
| Minimum | $37,557 | $41,486 |
| Maximum | $120,179 | $158,906 |
| Range | $82,622 | $117,420 |
| Mean | $83,404 | $89,344 |
| Median | $85,145 | $89,581 |
| Interquartile 25% (IQ1) | $73,839 | $78,846 |
| Interquartile 75% (IQ3) | $95,038 | $96,669 |
| Interquartile Range (IQR) | $21,199 | $17,823 |
| Standard Deviation (Sample) | $17,709 | $21,166 |
| Standard Deviation (Population) | $17,595 | $21,010 |
Demographics Similar to Peruvians and Immigrants from Jordan by Median Household Income
In terms of median household income, the demographic groups most similar to Peruvians are Northern European ($90,446, a difference of 0.20%), Immigrants from Northern Africa ($90,026, a difference of 0.26%), Immigrants from Western Asia ($90,005, a difference of 0.28%), Immigrants from Poland ($90,549, a difference of 0.32%), and Palestinian ($90,574, a difference of 0.35%). Similarly, the demographic groups most similar to Immigrants from Jordan are Immigrants from Zimbabwe ($89,496, a difference of 0.090%), Immigrants from Kuwait ($89,263, a difference of 0.17%), Ethiopian ($89,640, a difference of 0.25%), Pakistani ($89,638, a difference of 0.25%), and Immigrants from Oceania ($89,100, a difference of 0.35%).
| Demographics | Rating | Rank | Median Household Income |
| Zimbabweans | 97.2 /100 | #108 | Exceptional $90,618 |
| Chileans | 97.2 /100 | #109 | Exceptional $90,605 |
| Palestinians | 97.1 /100 | #110 | Exceptional $90,574 |
| Immigrants | Poland | 97.1 /100 | #111 | Exceptional $90,549 |
| Northern Europeans | 96.9 /100 | #112 | Exceptional $90,446 |
| Peruvians | 96.5 /100 | #113 | Exceptional $90,261 |
| Immigrants | Northern Africa | 95.9 /100 | #114 | Exceptional $90,026 |
| Immigrants | Western Asia | 95.9 /100 | #115 | Exceptional $90,005 |
| Native Hawaiians | 95.7 /100 | #116 | Exceptional $89,919 |
| Taiwanese | 95.6 /100 | #117 | Exceptional $89,900 |
| Syrians | 95.4 /100 | #118 | Exceptional $89,830 |
| Albanians | 95.2 /100 | #119 | Exceptional $89,744 |
| Immigrants | North Macedonia | 95.2 /100 | #120 | Exceptional $89,741 |
| Ethiopians | 94.9 /100 | #121 | Exceptional $89,640 |
| Pakistanis | 94.8 /100 | #122 | Exceptional $89,638 |
| Immigrants | Zimbabwe | 94.4 /100 | #123 | Exceptional $89,496 |
| Immigrants | Jordan | 94.1 /100 | #124 | Exceptional $89,412 |
| Immigrants | Kuwait | 93.5 /100 | #125 | Exceptional $89,263 |
| Immigrants | Oceania | 92.9 /100 | #126 | Exceptional $89,100 |
| Immigrants | Peru | 92.5 /100 | #127 | Exceptional $89,010 |
| Portuguese | 92.3 /100 | #128 | Exceptional $88,976 |