Peruvian vs Serbian Median Household Income
COMPARE
Peruvian
Serbian
Median Household Income
Median Household Income Comparison
Peruvians
Serbians
$90,261
MEDIAN HOUSEHOLD INCOME
96.5/ 100
METRIC RATING
113th/ 347
METRIC RANK
$87,572
MEDIAN HOUSEHOLD INCOME
83.0/ 100
METRIC RATING
144th/ 347
METRIC RANK
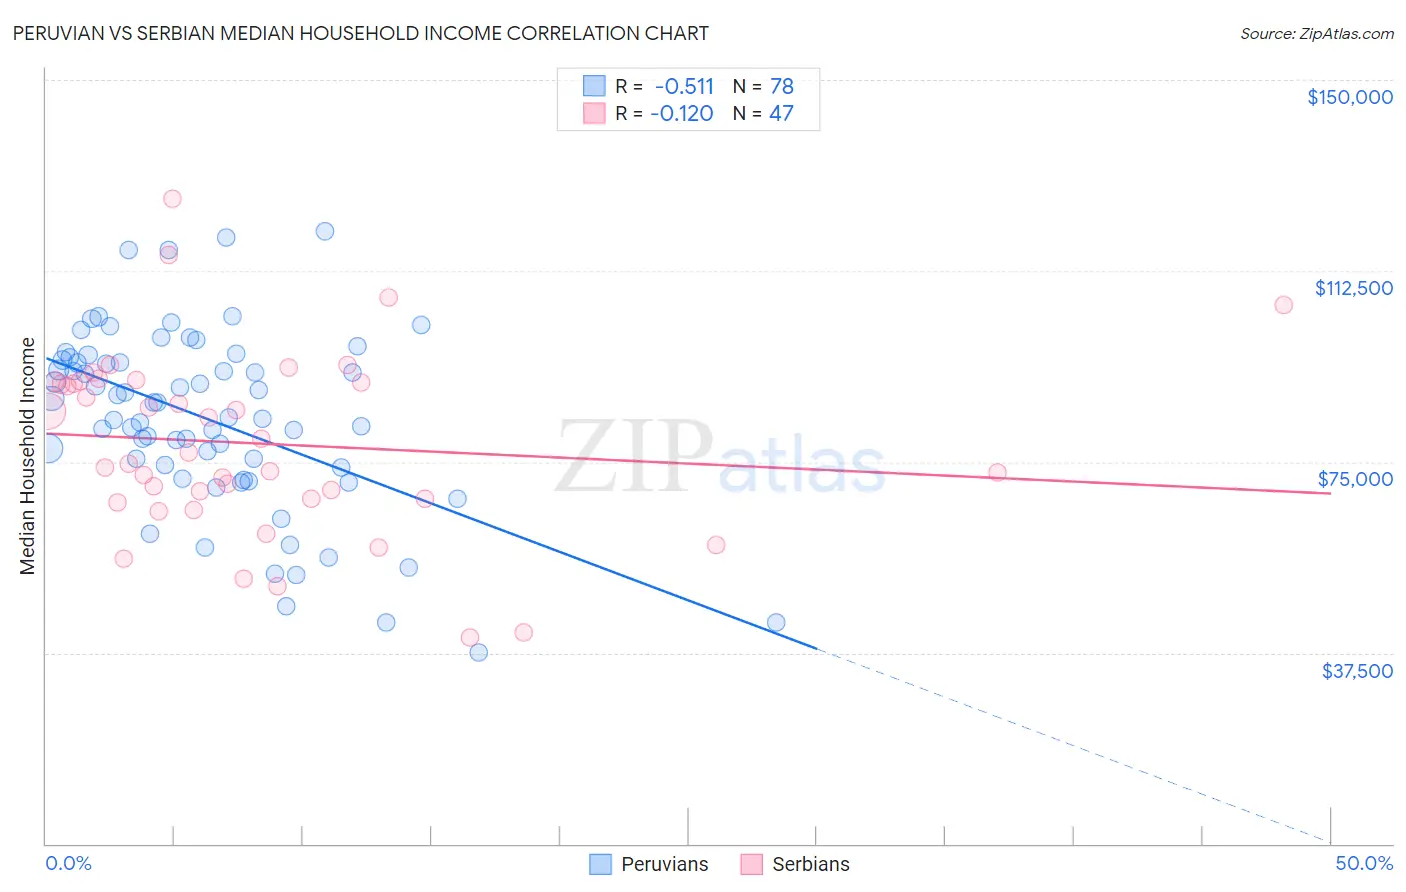
Peruvian vs Serbian Median Household Income Correlation Chart
The statistical analysis conducted on geographies consisting of 362,893,410 people shows a substantial negative correlation between the proportion of Peruvians and median household income in the United States with a correlation coefficient (R) of -0.511 and weighted average of $90,261. Similarly, the statistical analysis conducted on geographies consisting of 267,501,646 people shows a poor negative correlation between the proportion of Serbians and median household income in the United States with a correlation coefficient (R) of -0.120 and weighted average of $87,572, a difference of 3.1%.
Median Household Income Correlation Summary
| Measurement | Peruvian | Serbian |
| Minimum | $37,557 | $40,500 |
| Maximum | $120,179 | $126,567 |
| Range | $82,622 | $86,067 |
| Mean | $83,404 | $78,611 |
| Median | $85,145 | $76,777 |
| Interquartile 25% (IQ1) | $73,839 | $67,750 |
| Interquartile 75% (IQ3) | $95,038 | $90,729 |
| Interquartile Range (IQR) | $21,199 | $22,979 |
| Standard Deviation (Sample) | $17,709 | $17,894 |
| Standard Deviation (Population) | $17,595 | $17,703 |
Similar Demographics by Median Household Income
Demographics Similar to Peruvians by Median Household Income
In terms of median household income, the demographic groups most similar to Peruvians are Northern European ($90,446, a difference of 0.20%), Immigrants from Northern Africa ($90,026, a difference of 0.26%), Immigrants from Western Asia ($90,005, a difference of 0.28%), Immigrants from Poland ($90,549, a difference of 0.32%), and Palestinian ($90,574, a difference of 0.35%).
| Demographics | Rating | Rank | Median Household Income |
| Macedonians | 97.4 /100 | #106 | Exceptional $90,761 |
| Croatians | 97.3 /100 | #107 | Exceptional $90,685 |
| Zimbabweans | 97.2 /100 | #108 | Exceptional $90,618 |
| Chileans | 97.2 /100 | #109 | Exceptional $90,605 |
| Palestinians | 97.1 /100 | #110 | Exceptional $90,574 |
| Immigrants | Poland | 97.1 /100 | #111 | Exceptional $90,549 |
| Northern Europeans | 96.9 /100 | #112 | Exceptional $90,446 |
| Peruvians | 96.5 /100 | #113 | Exceptional $90,261 |
| Immigrants | Northern Africa | 95.9 /100 | #114 | Exceptional $90,026 |
| Immigrants | Western Asia | 95.9 /100 | #115 | Exceptional $90,005 |
| Native Hawaiians | 95.7 /100 | #116 | Exceptional $89,919 |
| Taiwanese | 95.6 /100 | #117 | Exceptional $89,900 |
| Syrians | 95.4 /100 | #118 | Exceptional $89,830 |
| Albanians | 95.2 /100 | #119 | Exceptional $89,744 |
| Immigrants | North Macedonia | 95.2 /100 | #120 | Exceptional $89,741 |
Demographics Similar to Serbians by Median Household Income
In terms of median household income, the demographic groups most similar to Serbians are Ugandan ($87,557, a difference of 0.020%), Immigrants from Uganda ($87,553, a difference of 0.020%), Danish ($87,676, a difference of 0.12%), South American Indian ($87,446, a difference of 0.14%), and Canadian ($87,769, a difference of 0.22%).
| Demographics | Rating | Rank | Median Household Income |
| Sierra Leoneans | 89.6 /100 | #137 | Excellent $88,463 |
| Arabs | 89.2 /100 | #138 | Excellent $88,398 |
| Immigrants | Chile | 89.2 /100 | #139 | Excellent $88,388 |
| Lebanese | 87.2 /100 | #140 | Excellent $88,091 |
| Immigrants | Morocco | 86.0 /100 | #141 | Excellent $87,930 |
| Canadians | 84.7 /100 | #142 | Excellent $87,769 |
| Danes | 83.9 /100 | #143 | Excellent $87,676 |
| Serbians | 83.0 /100 | #144 | Excellent $87,572 |
| Ugandans | 82.9 /100 | #145 | Excellent $87,557 |
| Immigrants | Uganda | 82.8 /100 | #146 | Excellent $87,553 |
| South American Indians | 81.8 /100 | #147 | Excellent $87,446 |
| Costa Ricans | 80.0 /100 | #148 | Excellent $87,262 |
| Immigrants | Nepal | 77.7 /100 | #149 | Good $87,046 |
| Basques | 77.2 /100 | #150 | Good $87,001 |
| Hungarians | 76.3 /100 | #151 | Good $86,920 |