Peruvian vs Immigrants from Jordan Unemployment Among Women with Children Under 6 years
COMPARE
Peruvian
Immigrants from Jordan
Unemployment Among Women with Children Under 6 years
Unemployment Among Women with Children Under 6 years Comparison
Peruvians
Immigrants from Jordan
7.5%
UNEMPLOYMENT AMONG WOMEN WITH CHILDREN UNDER 6 YEARS
72.3/ 100
METRIC RATING
157th/ 347
METRIC RANK
7.5%
UNEMPLOYMENT AMONG WOMEN WITH CHILDREN UNDER 6 YEARS
78.9/ 100
METRIC RATING
145th/ 347
METRIC RANK
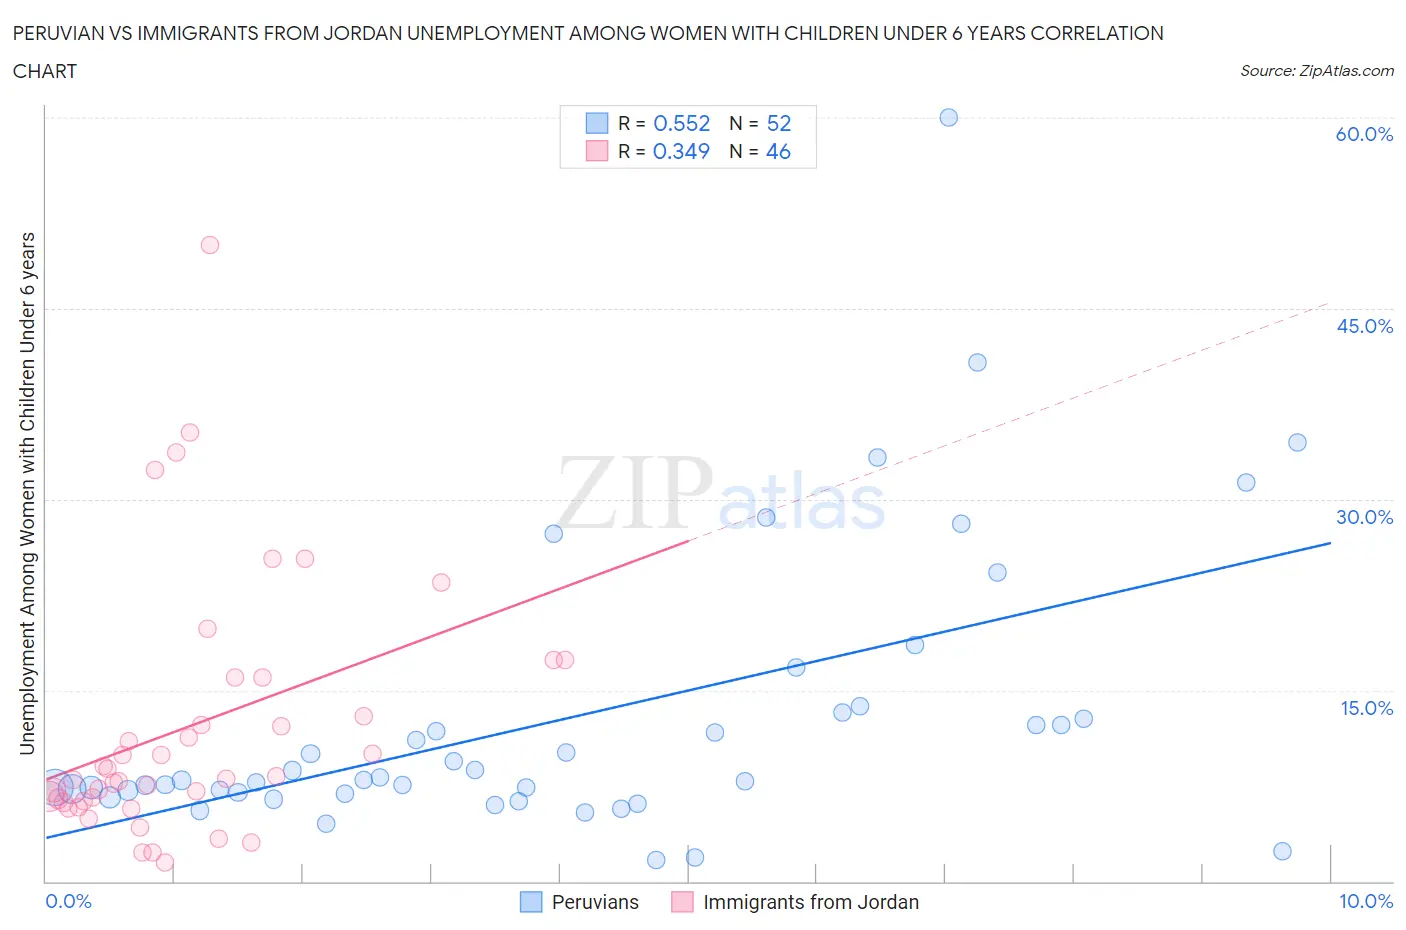
Peruvian vs Immigrants from Jordan Unemployment Among Women with Children Under 6 years Correlation Chart
The statistical analysis conducted on geographies consisting of 286,643,171 people shows a substantial positive correlation between the proportion of Peruvians and unemployment rate among women with children under the age of 6 in the United States with a correlation coefficient (R) of 0.552 and weighted average of 7.5%. Similarly, the statistical analysis conducted on geographies consisting of 157,070,333 people shows a mild positive correlation between the proportion of Immigrants from Jordan and unemployment rate among women with children under the age of 6 in the United States with a correlation coefficient (R) of 0.349 and weighted average of 7.5%, a difference of 0.61%.
Unemployment Among Women with Children Under 6 years Correlation Summary
| Measurement | Peruvian | Immigrants from Jordan |
| Minimum | 1.7% | 1.5% |
| Maximum | 60.0% | 50.0% |
| Range | 58.3% | 48.5% |
| Mean | 12.8% | 12.2% |
| Median | 7.9% | 8.2% |
| Interquartile 25% (IQ1) | 6.9% | 6.3% |
| Interquartile 75% (IQ3) | 13.1% | 16.0% |
| Interquartile Range (IQR) | 6.1% | 9.7% |
| Standard Deviation (Sample) | 11.2% | 10.1% |
| Standard Deviation (Population) | 11.1% | 9.9% |
Demographics Similar to Peruvians and Immigrants from Jordan by Unemployment Among Women with Children Under 6 years
In terms of unemployment among women with children under 6 years, the demographic groups most similar to Peruvians are Croatian (7.5%, a difference of 0.030%), Immigrants from Southern Europe (7.5%, a difference of 0.080%), Immigrants from Philippines (7.5%, a difference of 0.080%), Bolivian (7.5%, a difference of 0.12%), and South American (7.5%, a difference of 0.16%). Similarly, the demographic groups most similar to Immigrants from Jordan are Japanese (7.5%, a difference of 0.0%), European (7.5%, a difference of 0.030%), Immigrants from Oceania (7.5%, a difference of 0.050%), Immigrants from Brazil (7.5%, a difference of 0.16%), and Korean (7.5%, a difference of 0.26%).
| Demographics | Rating | Rank | Unemployment Among Women with Children Under 6 years |
| Greeks | 82.6 /100 | #141 | Excellent 7.4% |
| Immigrants | Argentina | 81.5 /100 | #142 | Excellent 7.5% |
| Koreans | 81.3 /100 | #143 | Excellent 7.5% |
| Europeans | 79.1 /100 | #144 | Good 7.5% |
| Immigrants | Jordan | 78.9 /100 | #145 | Good 7.5% |
| Japanese | 78.9 /100 | #146 | Good 7.5% |
| Immigrants | Oceania | 78.4 /100 | #147 | Good 7.5% |
| Immigrants | Brazil | 77.3 /100 | #148 | Good 7.5% |
| Colombians | 76.1 /100 | #149 | Good 7.5% |
| Aleuts | 76.0 /100 | #150 | Good 7.5% |
| Immigrants | Peru | 74.9 /100 | #151 | Good 7.5% |
| Bangladeshis | 74.8 /100 | #152 | Good 7.5% |
| Uruguayans | 74.7 /100 | #153 | Good 7.5% |
| Northern Europeans | 74.3 /100 | #154 | Good 7.5% |
| South Americans | 74.1 /100 | #155 | Good 7.5% |
| Immigrants | Southern Europe | 73.2 /100 | #156 | Good 7.5% |
| Peruvians | 72.3 /100 | #157 | Good 7.5% |
| Croatians | 71.9 /100 | #158 | Good 7.5% |
| Immigrants | Philippines | 71.3 /100 | #159 | Good 7.5% |
| Bolivians | 70.8 /100 | #160 | Good 7.5% |
| Immigrants | Western Asia | 70.2 /100 | #161 | Good 7.5% |