Peruvian vs Immigrants from Jordan Ambulatory Disability
COMPARE
Peruvian
Immigrants from Jordan
Ambulatory Disability
Ambulatory Disability Comparison
Peruvians
Immigrants from Jordan
5.7%
AMBULATORY DISABILITY
99.5/ 100
METRIC RATING
69th/ 347
METRIC RANK
5.7%
AMBULATORY DISABILITY
99.2/ 100
METRIC RATING
81st/ 347
METRIC RANK
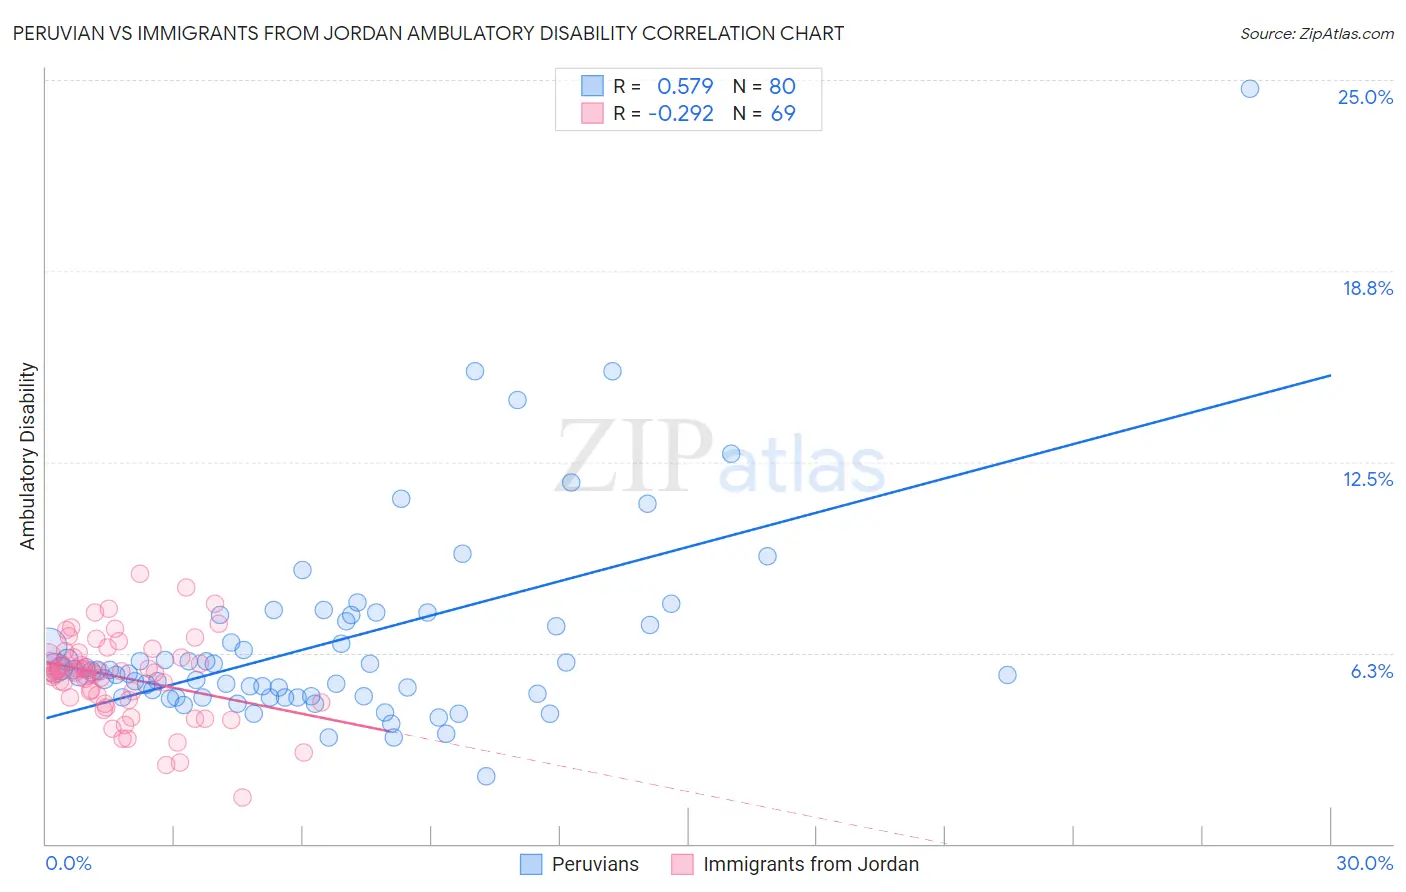
Peruvian vs Immigrants from Jordan Ambulatory Disability Correlation Chart
The statistical analysis conducted on geographies consisting of 363,114,873 people shows a substantial positive correlation between the proportion of Peruvians and percentage of population with ambulatory disability in the United States with a correlation coefficient (R) of 0.579 and weighted average of 5.7%. Similarly, the statistical analysis conducted on geographies consisting of 181,269,756 people shows a weak negative correlation between the proportion of Immigrants from Jordan and percentage of population with ambulatory disability in the United States with a correlation coefficient (R) of -0.292 and weighted average of 5.7%, a difference of 0.77%.
Ambulatory Disability Correlation Summary
| Measurement | Peruvian | Immigrants from Jordan |
| Minimum | 2.2% | 1.5% |
| Maximum | 24.7% | 8.9% |
| Range | 22.5% | 7.3% |
| Mean | 6.6% | 5.5% |
| Median | 5.7% | 5.6% |
| Interquartile 25% (IQ1) | 4.8% | 4.7% |
| Interquartile 75% (IQ3) | 7.2% | 6.2% |
| Interquartile Range (IQR) | 2.4% | 1.5% |
| Standard Deviation (Sample) | 3.3% | 1.4% |
| Standard Deviation (Population) | 3.3% | 1.4% |
Demographics Similar to Peruvians and Immigrants from Jordan by Ambulatory Disability
In terms of ambulatory disability, the demographic groups most similar to Peruvians are Sierra Leonean (5.7%, a difference of 0.23%), Immigrants from Peru (5.7%, a difference of 0.32%), Brazilian (5.7%, a difference of 0.34%), Immigrants from Northern Africa (5.7%, a difference of 0.36%), and Immigrants from Cameroon (5.7%, a difference of 0.36%). Similarly, the demographic groups most similar to Immigrants from Jordan are Palestinian (5.7%, a difference of 0.0%), Immigrants from Ireland (5.7%, a difference of 0.010%), Eastern European (5.7%, a difference of 0.020%), Ugandan (5.7%, a difference of 0.030%), and Somali (5.7%, a difference of 0.14%).
| Demographics | Rating | Rank | Ambulatory Disability |
| Immigrants | Switzerland | 99.7 /100 | #65 | Exceptional 5.7% |
| Israelis | 99.6 /100 | #66 | Exceptional 5.7% |
| Immigrants | Uganda | 99.6 /100 | #67 | Exceptional 5.7% |
| Sri Lankans | 99.6 /100 | #68 | Exceptional 5.7% |
| Peruvians | 99.5 /100 | #69 | Exceptional 5.7% |
| Sierra Leoneans | 99.4 /100 | #70 | Exceptional 5.7% |
| Immigrants | Peru | 99.4 /100 | #71 | Exceptional 5.7% |
| Brazilians | 99.4 /100 | #72 | Exceptional 5.7% |
| Immigrants | Northern Africa | 99.4 /100 | #73 | Exceptional 5.7% |
| Immigrants | Cameroon | 99.4 /100 | #74 | Exceptional 5.7% |
| Immigrants | South Africa | 99.3 /100 | #75 | Exceptional 5.7% |
| Sudanese | 99.3 /100 | #76 | Exceptional 5.7% |
| Immigrants | Vietnam | 99.3 /100 | #77 | Exceptional 5.7% |
| Somalis | 99.2 /100 | #78 | Exceptional 5.7% |
| Chileans | 99.2 /100 | #79 | Exceptional 5.7% |
| Immigrants | Ireland | 99.2 /100 | #80 | Exceptional 5.7% |
| Immigrants | Jordan | 99.2 /100 | #81 | Exceptional 5.7% |
| Palestinians | 99.2 /100 | #82 | Exceptional 5.7% |
| Eastern Europeans | 99.2 /100 | #83 | Exceptional 5.7% |
| Ugandans | 99.2 /100 | #84 | Exceptional 5.7% |
| South Americans | 99.0 /100 | #85 | Exceptional 5.7% |