Peruvian vs Immigrants from Jordan GED/Equivalency
COMPARE
Peruvian
Immigrants from Jordan
GED/Equivalency
GED/Equivalency Comparison
Peruvians
Immigrants from Jordan
84.7%
GED/EQUIVALENCY
9.2/ 100
METRIC RATING
215th/ 347
METRIC RANK
86.8%
GED/EQUIVALENCY
90.8/ 100
METRIC RATING
122nd/ 347
METRIC RANK
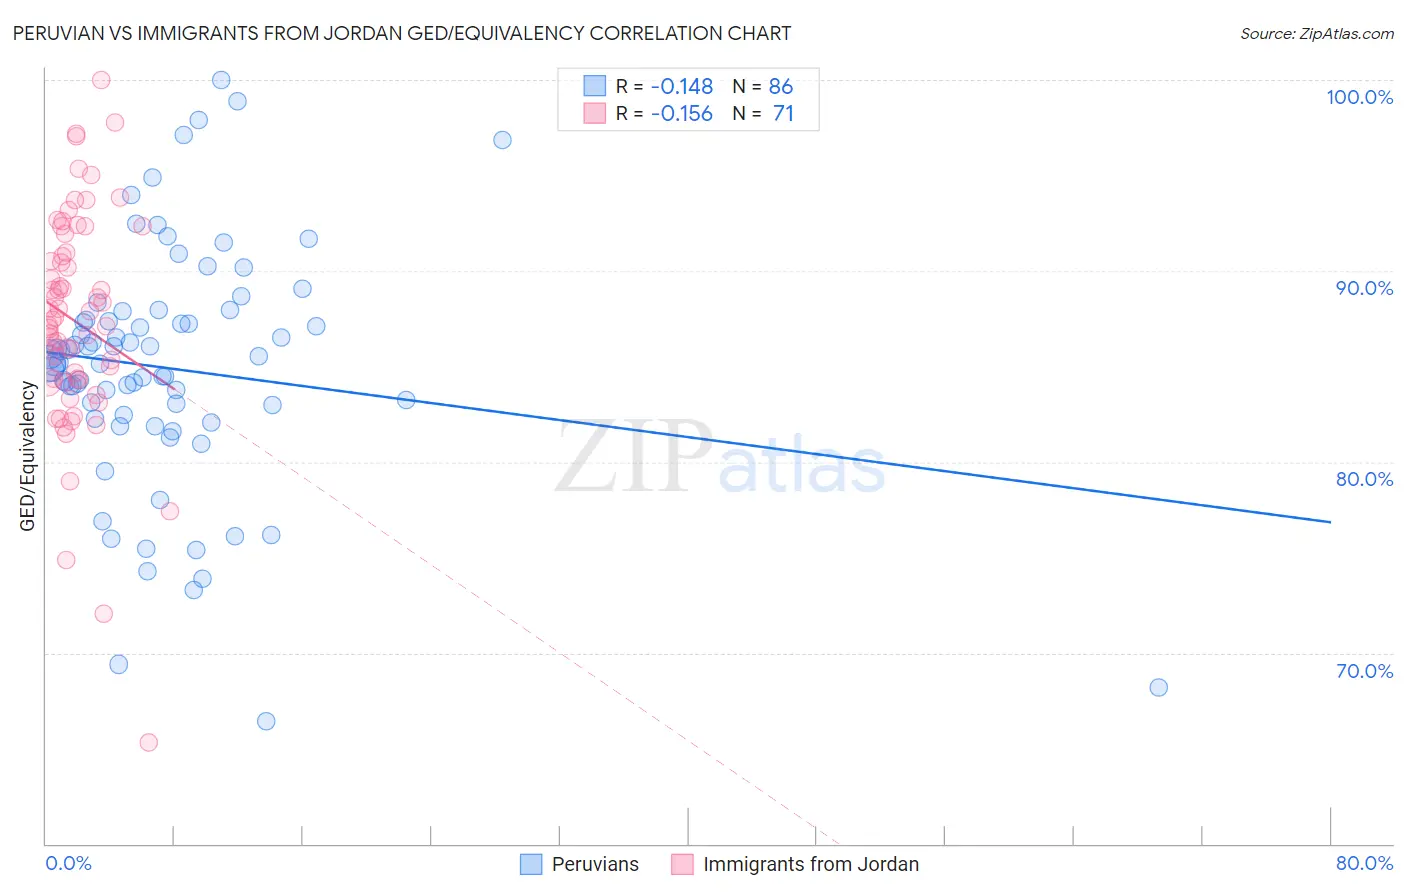
Peruvian vs Immigrants from Jordan GED/Equivalency Correlation Chart
The statistical analysis conducted on geographies consisting of 363,251,075 people shows a poor negative correlation between the proportion of Peruvians and percentage of population with at least ged/equivalency education in the United States with a correlation coefficient (R) of -0.148 and weighted average of 84.7%. Similarly, the statistical analysis conducted on geographies consisting of 181,276,674 people shows a poor negative correlation between the proportion of Immigrants from Jordan and percentage of population with at least ged/equivalency education in the United States with a correlation coefficient (R) of -0.156 and weighted average of 86.8%, a difference of 2.4%.
GED/Equivalency Correlation Summary
| Measurement | Peruvian | Immigrants from Jordan |
| Minimum | 66.4% | 65.3% |
| Maximum | 100.0% | 100.0% |
| Range | 33.6% | 34.7% |
| Mean | 84.9% | 87.3% |
| Median | 85.2% | 87.4% |
| Interquartile 25% (IQ1) | 82.5% | 84.3% |
| Interquartile 75% (IQ3) | 87.5% | 91.0% |
| Interquartile Range (IQR) | 5.0% | 6.6% |
| Standard Deviation (Sample) | 6.4% | 5.8% |
| Standard Deviation (Population) | 6.3% | 5.8% |
Similar Demographics by GED/Equivalency
Demographics Similar to Peruvians by GED/Equivalency
In terms of ged/equivalency, the demographic groups most similar to Peruvians are Osage (84.8%, a difference of 0.020%), Immigrants from Micronesia (84.7%, a difference of 0.030%), Nigerian (84.7%, a difference of 0.030%), Alaska Native (84.7%, a difference of 0.030%), and Immigrants from Philippines (84.8%, a difference of 0.050%).
| Demographics | Rating | Rank | GED/Equivalency |
| Marshallese | 12.5 /100 | #208 | Poor 84.9% |
| Colombians | 12.3 /100 | #209 | Poor 84.9% |
| Immigrants | Cameroon | 12.1 /100 | #210 | Poor 84.9% |
| South Americans | 10.9 /100 | #211 | Poor 84.8% |
| Immigrants | Somalia | 10.6 /100 | #212 | Poor 84.8% |
| Immigrants | Philippines | 10.0 /100 | #213 | Poor 84.8% |
| Osage | 9.5 /100 | #214 | Tragic 84.8% |
| Peruvians | 9.2 /100 | #215 | Tragic 84.7% |
| Immigrants | Micronesia | 8.7 /100 | #216 | Tragic 84.7% |
| Nigerians | 8.6 /100 | #217 | Tragic 84.7% |
| Alaska Natives | 8.6 /100 | #218 | Tragic 84.7% |
| Potawatomi | 8.2 /100 | #219 | Tragic 84.7% |
| Americans | 8.2 /100 | #220 | Tragic 84.7% |
| Taiwanese | 8.1 /100 | #221 | Tragic 84.7% |
| Iroquois | 7.5 /100 | #222 | Tragic 84.6% |
Demographics Similar to Immigrants from Jordan by GED/Equivalency
In terms of ged/equivalency, the demographic groups most similar to Immigrants from Jordan are Immigrants from Lebanon (86.8%, a difference of 0.0%), Immigrants from Italy (86.7%, a difference of 0.020%), Immigrants from Egypt (86.7%, a difference of 0.030%), Celtic (86.7%, a difference of 0.030%), and Asian (86.7%, a difference of 0.030%).
| Demographics | Rating | Rank | GED/Equivalency |
| Mongolians | 94.6 /100 | #115 | Exceptional 87.0% |
| Swiss | 94.5 /100 | #116 | Exceptional 87.0% |
| Immigrants | Hong Kong | 93.8 /100 | #117 | Exceptional 86.9% |
| French Canadians | 93.2 /100 | #118 | Exceptional 86.9% |
| Immigrants | China | 93.2 /100 | #119 | Exceptional 86.9% |
| Scotch-Irish | 91.6 /100 | #120 | Exceptional 86.8% |
| Immigrants | Lebanon | 90.9 /100 | #121 | Exceptional 86.8% |
| Immigrants | Jordan | 90.8 /100 | #122 | Exceptional 86.8% |
| Immigrants | Italy | 90.5 /100 | #123 | Exceptional 86.7% |
| Immigrants | Egypt | 90.4 /100 | #124 | Exceptional 86.7% |
| Celtics | 90.4 /100 | #125 | Exceptional 86.7% |
| Asians | 90.3 /100 | #126 | Exceptional 86.7% |
| Argentineans | 89.7 /100 | #127 | Excellent 86.7% |
| Yugoslavians | 89.5 /100 | #128 | Excellent 86.7% |
| Immigrants | Ukraine | 88.9 /100 | #129 | Excellent 86.7% |