Peruvian vs Immigrants from Jordan Unemployment Among Ages 35 to 44 years
COMPARE
Peruvian
Immigrants from Jordan
Unemployment Among Ages 35 to 44 years
Unemployment Among Ages 35 to 44 years Comparison
Peruvians
Immigrants from Jordan
4.7%
UNEMPLOYMENT AMONG AGES 35 TO 44 YEARS
54.4/ 100
METRIC RATING
167th/ 347
METRIC RANK
4.4%
UNEMPLOYMENT AMONG AGES 35 TO 44 YEARS
96.3/ 100
METRIC RATING
76th/ 347
METRIC RANK
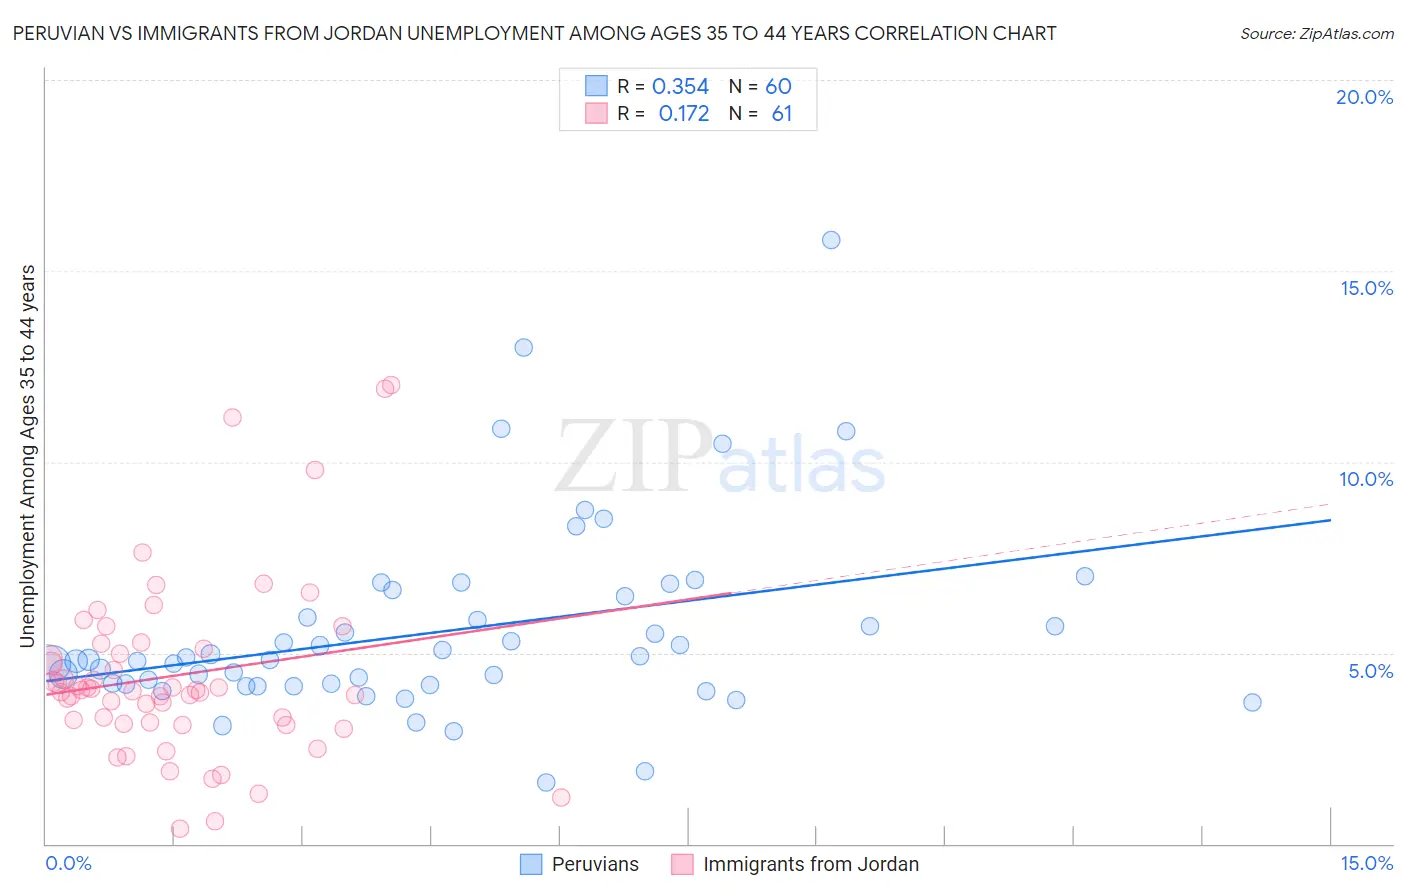
Peruvian vs Immigrants from Jordan Unemployment Among Ages 35 to 44 years Correlation Chart
The statistical analysis conducted on geographies consisting of 357,234,529 people shows a mild positive correlation between the proportion of Peruvians and unemployment rate among population between the ages 35 and 44 in the United States with a correlation coefficient (R) of 0.354 and weighted average of 4.7%. Similarly, the statistical analysis conducted on geographies consisting of 180,158,795 people shows a poor positive correlation between the proportion of Immigrants from Jordan and unemployment rate among population between the ages 35 and 44 in the United States with a correlation coefficient (R) of 0.172 and weighted average of 4.4%, a difference of 5.8%.
Unemployment Among Ages 35 to 44 years Correlation Summary
| Measurement | Peruvian | Immigrants from Jordan |
| Minimum | 1.6% | 0.40% |
| Maximum | 15.8% | 12.0% |
| Range | 14.2% | 11.6% |
| Mean | 5.6% | 4.4% |
| Median | 4.8% | 4.0% |
| Interquartile 25% (IQ1) | 4.2% | 3.2% |
| Interquartile 75% (IQ3) | 6.2% | 5.2% |
| Interquartile Range (IQR) | 2.0% | 2.0% |
| Standard Deviation (Sample) | 2.5% | 2.4% |
| Standard Deviation (Population) | 2.5% | 2.3% |
Similar Demographics by Unemployment Among Ages 35 to 44 years
Demographics Similar to Peruvians by Unemployment Among Ages 35 to 44 years
In terms of unemployment among ages 35 to 44 years, the demographic groups most similar to Peruvians are French (4.7%, a difference of 0.090%), Arab (4.7%, a difference of 0.090%), Pennsylvania German (4.7%, a difference of 0.10%), Immigrants from Indonesia (4.7%, a difference of 0.13%), and Indonesian (4.7%, a difference of 0.19%).
| Demographics | Rating | Rank | Unemployment Among Ages 35 to 44 years |
| Hungarians | 62.6 /100 | #160 | Good 4.6% |
| Celtics | 61.7 /100 | #161 | Good 4.7% |
| Costa Ricans | 59.6 /100 | #162 | Average 4.7% |
| South Africans | 58.5 /100 | #163 | Average 4.7% |
| Immigrants | Morocco | 57.2 /100 | #164 | Average 4.7% |
| German Russians | 57.2 /100 | #165 | Average 4.7% |
| French | 55.6 /100 | #166 | Average 4.7% |
| Peruvians | 54.4 /100 | #167 | Average 4.7% |
| Arabs | 53.1 /100 | #168 | Average 4.7% |
| Pennsylvania Germans | 53.0 /100 | #169 | Average 4.7% |
| Immigrants | Indonesia | 52.6 /100 | #170 | Average 4.7% |
| Indonesians | 51.7 /100 | #171 | Average 4.7% |
| Lebanese | 51.4 /100 | #172 | Average 4.7% |
| Iraqis | 50.9 /100 | #173 | Average 4.7% |
| Afghans | 50.0 /100 | #174 | Average 4.7% |
Demographics Similar to Immigrants from Jordan by Unemployment Among Ages 35 to 44 years
In terms of unemployment among ages 35 to 44 years, the demographic groups most similar to Immigrants from Jordan are Immigrants from Romania (4.4%, a difference of 0.030%), Polish (4.4%, a difference of 0.060%), Dutch (4.4%, a difference of 0.080%), Lithuanian (4.4%, a difference of 0.090%), and Northern European (4.4%, a difference of 0.12%).
| Demographics | Rating | Rank | Unemployment Among Ages 35 to 44 years |
| Slovenes | 96.7 /100 | #69 | Exceptional 4.4% |
| Immigrants | China | 96.7 /100 | #70 | Exceptional 4.4% |
| Immigrants | Lithuania | 96.7 /100 | #71 | Exceptional 4.4% |
| Northern Europeans | 96.5 /100 | #72 | Exceptional 4.4% |
| Lithuanians | 96.5 /100 | #73 | Exceptional 4.4% |
| Poles | 96.4 /100 | #74 | Exceptional 4.4% |
| Immigrants | Romania | 96.3 /100 | #75 | Exceptional 4.4% |
| Immigrants | Jordan | 96.3 /100 | #76 | Exceptional 4.4% |
| Dutch | 96.1 /100 | #77 | Exceptional 4.4% |
| Indians (Asian) | 96.0 /100 | #78 | Exceptional 4.4% |
| Immigrants | Sweden | 95.9 /100 | #79 | Exceptional 4.4% |
| Kenyans | 95.7 /100 | #80 | Exceptional 4.4% |
| Immigrants | Scotland | 95.6 /100 | #81 | Exceptional 4.4% |
| Immigrants | Asia | 95.6 /100 | #82 | Exceptional 4.4% |
| Immigrants | Australia | 95.3 /100 | #83 | Exceptional 4.4% |