Peruvian vs Dutch Median Household Income
COMPARE
Peruvian
Dutch
Median Household Income
Median Household Income Comparison
Peruvians
Dutch
$90,261
MEDIAN HOUSEHOLD INCOME
96.5/ 100
METRIC RATING
113th/ 347
METRIC RANK
$82,971
MEDIAN HOUSEHOLD INCOME
20.3/ 100
METRIC RATING
207th/ 347
METRIC RANK
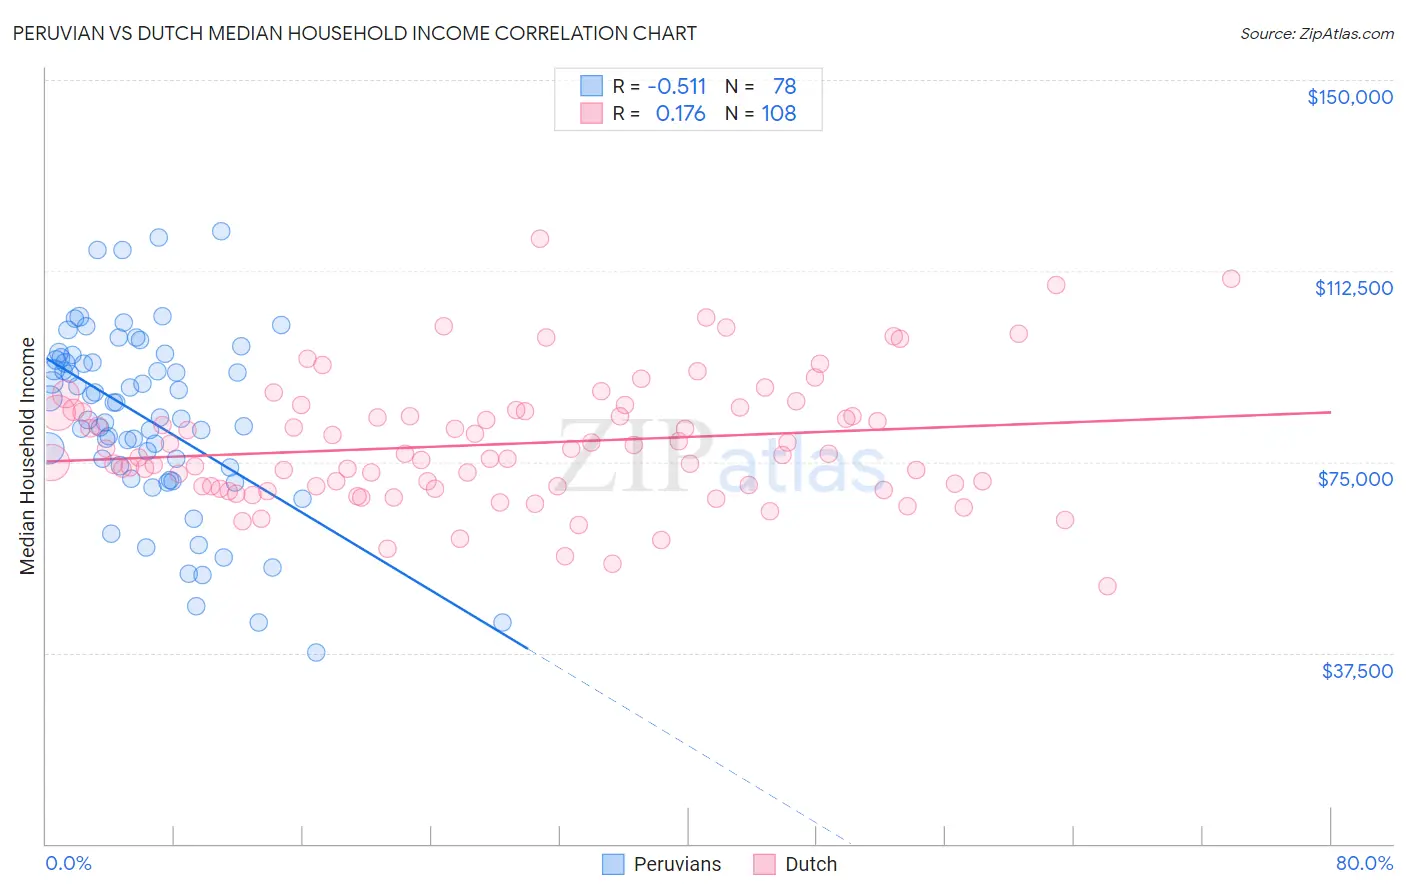
Peruvian vs Dutch Median Household Income Correlation Chart
The statistical analysis conducted on geographies consisting of 362,893,410 people shows a substantial negative correlation between the proportion of Peruvians and median household income in the United States with a correlation coefficient (R) of -0.511 and weighted average of $90,261. Similarly, the statistical analysis conducted on geographies consisting of 553,516,868 people shows a poor positive correlation between the proportion of Dutch and median household income in the United States with a correlation coefficient (R) of 0.176 and weighted average of $82,971, a difference of 8.8%.
Median Household Income Correlation Summary
| Measurement | Peruvian | Dutch |
| Minimum | $37,557 | $50,679 |
| Maximum | $120,179 | $118,750 |
| Range | $82,622 | $68,071 |
| Mean | $83,404 | $78,501 |
| Median | $85,145 | $76,487 |
| Interquartile 25% (IQ1) | $73,839 | $70,197 |
| Interquartile 75% (IQ3) | $95,038 | $84,813 |
| Interquartile Range (IQR) | $21,199 | $14,616 |
| Standard Deviation (Sample) | $17,709 | $12,272 |
| Standard Deviation (Population) | $17,595 | $12,215 |
Similar Demographics by Median Household Income
Demographics Similar to Peruvians by Median Household Income
In terms of median household income, the demographic groups most similar to Peruvians are Northern European ($90,446, a difference of 0.20%), Immigrants from Northern Africa ($90,026, a difference of 0.26%), Immigrants from Western Asia ($90,005, a difference of 0.28%), Immigrants from Poland ($90,549, a difference of 0.32%), and Palestinian ($90,574, a difference of 0.35%).
| Demographics | Rating | Rank | Median Household Income |
| Macedonians | 97.4 /100 | #106 | Exceptional $90,761 |
| Croatians | 97.3 /100 | #107 | Exceptional $90,685 |
| Zimbabweans | 97.2 /100 | #108 | Exceptional $90,618 |
| Chileans | 97.2 /100 | #109 | Exceptional $90,605 |
| Palestinians | 97.1 /100 | #110 | Exceptional $90,574 |
| Immigrants | Poland | 97.1 /100 | #111 | Exceptional $90,549 |
| Northern Europeans | 96.9 /100 | #112 | Exceptional $90,446 |
| Peruvians | 96.5 /100 | #113 | Exceptional $90,261 |
| Immigrants | Northern Africa | 95.9 /100 | #114 | Exceptional $90,026 |
| Immigrants | Western Asia | 95.9 /100 | #115 | Exceptional $90,005 |
| Native Hawaiians | 95.7 /100 | #116 | Exceptional $89,919 |
| Taiwanese | 95.6 /100 | #117 | Exceptional $89,900 |
| Syrians | 95.4 /100 | #118 | Exceptional $89,830 |
| Albanians | 95.2 /100 | #119 | Exceptional $89,744 |
| Immigrants | North Macedonia | 95.2 /100 | #120 | Exceptional $89,741 |
Demographics Similar to Dutch by Median Household Income
In terms of median household income, the demographic groups most similar to Dutch are Immigrants from Kenya ($83,068, a difference of 0.12%), French Canadian ($82,810, a difference of 0.19%), Celtic ($83,193, a difference of 0.27%), Immigrants from Africa ($83,289, a difference of 0.38%), and Immigrants from Cambodia ($83,304, a difference of 0.40%).
| Demographics | Rating | Rank | Median Household Income |
| Tsimshian | 24.5 /100 | #200 | Fair $83,346 |
| Spanish | 24.4 /100 | #201 | Fair $83,343 |
| Immigrants | Thailand | 24.3 /100 | #202 | Fair $83,327 |
| Immigrants | Cambodia | 24.0 /100 | #203 | Fair $83,304 |
| Immigrants | Africa | 23.8 /100 | #204 | Fair $83,289 |
| Celtics | 22.7 /100 | #205 | Fair $83,193 |
| Immigrants | Kenya | 21.3 /100 | #206 | Fair $83,068 |
| Dutch | 20.3 /100 | #207 | Fair $82,971 |
| French Canadians | 18.7 /100 | #208 | Poor $82,810 |
| Immigrants | Iraq | 16.7 /100 | #209 | Poor $82,594 |
| Immigrants | Uruguay | 16.4 /100 | #210 | Poor $82,560 |
| Salvadorans | 15.4 /100 | #211 | Poor $82,449 |
| Venezuelans | 15.3 /100 | #212 | Poor $82,432 |
| Nepalese | 15.1 /100 | #213 | Poor $82,410 |
| Panamanians | 14.0 /100 | #214 | Poor $82,272 |