Serbian vs Immigrants from Jordan Median Household Income
COMPARE
Serbian
Immigrants from Jordan
Median Household Income
Median Household Income Comparison
Serbians
Immigrants from Jordan
$87,572
MEDIAN HOUSEHOLD INCOME
83.0/ 100
METRIC RATING
144th/ 347
METRIC RANK
$89,412
MEDIAN HOUSEHOLD INCOME
94.1/ 100
METRIC RATING
124th/ 347
METRIC RANK
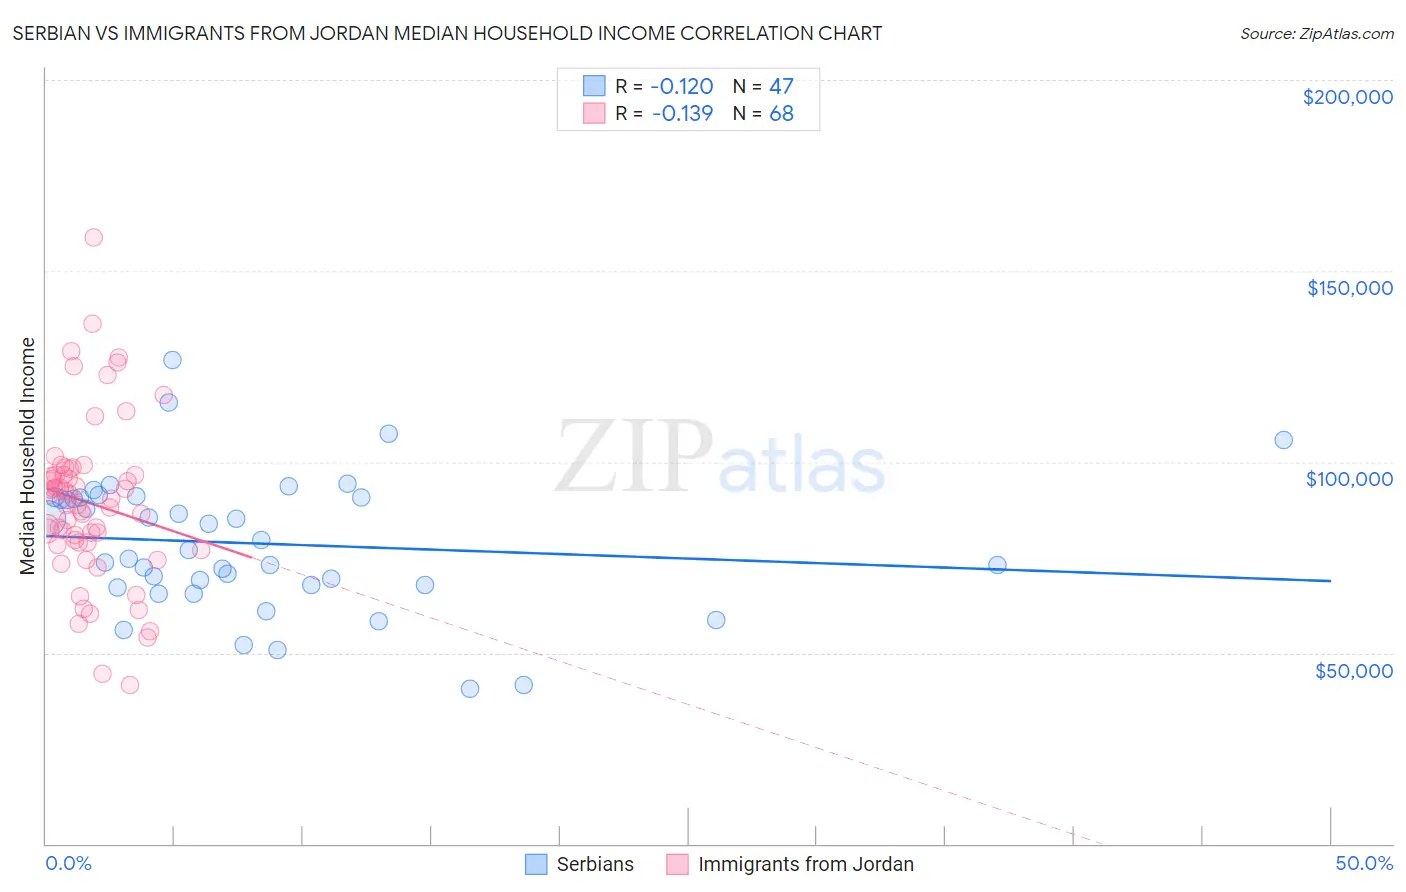
Serbian vs Immigrants from Jordan Median Household Income Correlation Chart
The statistical analysis conducted on geographies consisting of 267,501,646 people shows a poor negative correlation between the proportion of Serbians and median household income in the United States with a correlation coefficient (R) of -0.120 and weighted average of $87,572. Similarly, the statistical analysis conducted on geographies consisting of 181,227,500 people shows a poor negative correlation between the proportion of Immigrants from Jordan and median household income in the United States with a correlation coefficient (R) of -0.139 and weighted average of $89,412, a difference of 2.1%.
Median Household Income Correlation Summary
| Measurement | Serbian | Immigrants from Jordan |
| Minimum | $40,500 | $41,486 |
| Maximum | $126,567 | $158,906 |
| Range | $86,067 | $117,420 |
| Mean | $78,611 | $89,344 |
| Median | $76,777 | $89,581 |
| Interquartile 25% (IQ1) | $67,750 | $78,846 |
| Interquartile 75% (IQ3) | $90,729 | $96,669 |
| Interquartile Range (IQR) | $22,979 | $17,823 |
| Standard Deviation (Sample) | $17,894 | $21,166 |
| Standard Deviation (Population) | $17,703 | $21,010 |
Demographics Similar to Serbians and Immigrants from Jordan by Median Household Income
In terms of median household income, the demographic groups most similar to Serbians are Danish ($87,676, a difference of 0.12%), Canadian ($87,769, a difference of 0.22%), Immigrants from Morocco ($87,930, a difference of 0.41%), Lebanese ($88,091, a difference of 0.59%), and Immigrants from Chile ($88,388, a difference of 0.93%). Similarly, the demographic groups most similar to Immigrants from Jordan are Immigrants from Kuwait ($89,263, a difference of 0.17%), Immigrants from Oceania ($89,100, a difference of 0.35%), Immigrants from Peru ($89,010, a difference of 0.45%), Portuguese ($88,976, a difference of 0.49%), and Brazilian ($88,934, a difference of 0.54%).
| Demographics | Rating | Rank | Median Household Income |
| Immigrants | Jordan | 94.1 /100 | #124 | Exceptional $89,412 |
| Immigrants | Kuwait | 93.5 /100 | #125 | Exceptional $89,263 |
| Immigrants | Oceania | 92.9 /100 | #126 | Exceptional $89,100 |
| Immigrants | Peru | 92.5 /100 | #127 | Exceptional $89,010 |
| Portuguese | 92.3 /100 | #128 | Exceptional $88,976 |
| Brazilians | 92.1 /100 | #129 | Exceptional $88,934 |
| British | 92.0 /100 | #130 | Exceptional $88,914 |
| Immigrants | Syria | 91.4 /100 | #131 | Exceptional $88,792 |
| Europeans | 91.2 /100 | #132 | Exceptional $88,751 |
| Immigrants | Ethiopia | 90.9 /100 | #133 | Exceptional $88,687 |
| Swedes | 90.0 /100 | #134 | Exceptional $88,524 |
| Immigrants | Sierra Leone | 89.9 /100 | #135 | Excellent $88,498 |
| Poles | 89.7 /100 | #136 | Excellent $88,472 |
| Sierra Leoneans | 89.6 /100 | #137 | Excellent $88,463 |
| Arabs | 89.2 /100 | #138 | Excellent $88,398 |
| Immigrants | Chile | 89.2 /100 | #139 | Excellent $88,388 |
| Lebanese | 87.2 /100 | #140 | Excellent $88,091 |
| Immigrants | Morocco | 86.0 /100 | #141 | Excellent $87,930 |
| Canadians | 84.7 /100 | #142 | Excellent $87,769 |
| Danes | 83.9 /100 | #143 | Excellent $87,676 |
| Serbians | 83.0 /100 | #144 | Excellent $87,572 |