Peruvian vs Immigrants from South America Median Household Income
COMPARE
Peruvian
Immigrants from South America
Median Household Income
Median Household Income Comparison
Peruvians
Immigrants from South America
$90,261
MEDIAN HOUSEHOLD INCOME
96.5/ 100
METRIC RATING
113th/ 347
METRIC RANK
$85,611
MEDIAN HOUSEHOLD INCOME
58.1/ 100
METRIC RATING
171st/ 347
METRIC RANK
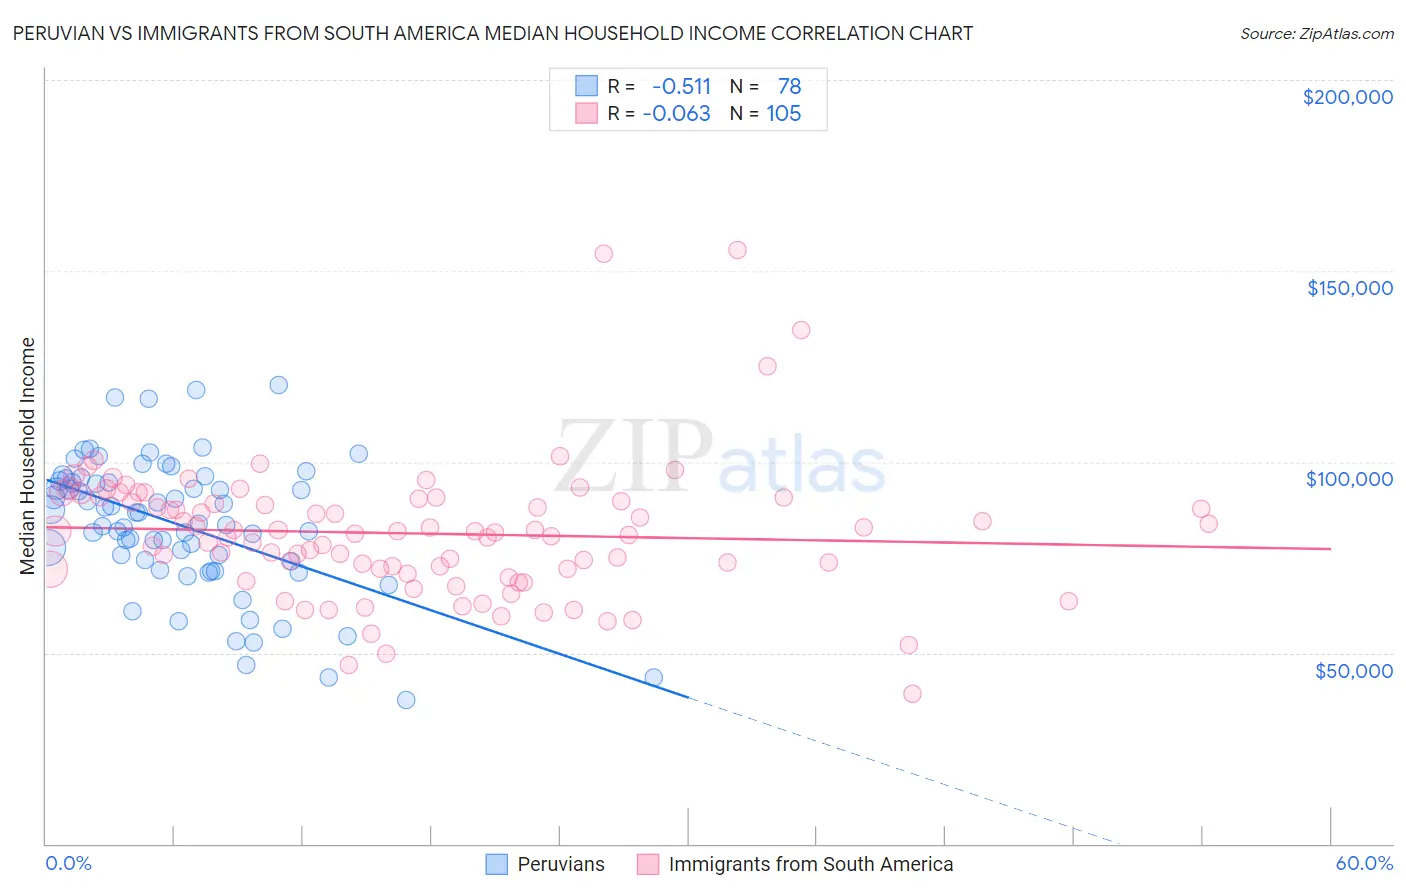
Peruvian vs Immigrants from South America Median Household Income Correlation Chart
The statistical analysis conducted on geographies consisting of 362,893,410 people shows a substantial negative correlation between the proportion of Peruvians and median household income in the United States with a correlation coefficient (R) of -0.511 and weighted average of $90,261. Similarly, the statistical analysis conducted on geographies consisting of 485,852,946 people shows a slight negative correlation between the proportion of Immigrants from South America and median household income in the United States with a correlation coefficient (R) of -0.063 and weighted average of $85,611, a difference of 5.4%.
Median Household Income Correlation Summary
| Measurement | Peruvian | Immigrants from South America |
| Minimum | $37,557 | $39,375 |
| Maximum | $120,179 | $155,583 |
| Range | $82,622 | $116,208 |
| Mean | $83,404 | $81,259 |
| Median | $85,145 | $81,529 |
| Interquartile 25% (IQ1) | $73,839 | $71,899 |
| Interquartile 75% (IQ3) | $95,038 | $90,608 |
| Interquartile Range (IQR) | $21,199 | $18,709 |
| Standard Deviation (Sample) | $17,709 | $17,852 |
| Standard Deviation (Population) | $17,595 | $17,766 |
Similar Demographics by Median Household Income
Demographics Similar to Peruvians by Median Household Income
In terms of median household income, the demographic groups most similar to Peruvians are Northern European ($90,446, a difference of 0.20%), Immigrants from Northern Africa ($90,026, a difference of 0.26%), Immigrants from Western Asia ($90,005, a difference of 0.28%), Immigrants from Poland ($90,549, a difference of 0.32%), and Palestinian ($90,574, a difference of 0.35%).
| Demographics | Rating | Rank | Median Household Income |
| Macedonians | 97.4 /100 | #106 | Exceptional $90,761 |
| Croatians | 97.3 /100 | #107 | Exceptional $90,685 |
| Zimbabweans | 97.2 /100 | #108 | Exceptional $90,618 |
| Chileans | 97.2 /100 | #109 | Exceptional $90,605 |
| Palestinians | 97.1 /100 | #110 | Exceptional $90,574 |
| Immigrants | Poland | 97.1 /100 | #111 | Exceptional $90,549 |
| Northern Europeans | 96.9 /100 | #112 | Exceptional $90,446 |
| Peruvians | 96.5 /100 | #113 | Exceptional $90,261 |
| Immigrants | Northern Africa | 95.9 /100 | #114 | Exceptional $90,026 |
| Immigrants | Western Asia | 95.9 /100 | #115 | Exceptional $90,005 |
| Native Hawaiians | 95.7 /100 | #116 | Exceptional $89,919 |
| Taiwanese | 95.6 /100 | #117 | Exceptional $89,900 |
| Syrians | 95.4 /100 | #118 | Exceptional $89,830 |
| Albanians | 95.2 /100 | #119 | Exceptional $89,744 |
| Immigrants | North Macedonia | 95.2 /100 | #120 | Exceptional $89,741 |
Demographics Similar to Immigrants from South America by Median Household Income
In terms of median household income, the demographic groups most similar to Immigrants from South America are Slovene ($85,562, a difference of 0.060%), Swiss ($85,681, a difference of 0.080%), Colombian ($85,716, a difference of 0.12%), Icelander ($85,797, a difference of 0.22%), and Immigrants ($85,818, a difference of 0.24%).
| Demographics | Rating | Rank | Median Household Income |
| Irish | 66.2 /100 | #164 | Good $86,145 |
| Norwegians | 65.3 /100 | #165 | Good $86,084 |
| Scandinavians | 65.1 /100 | #166 | Good $86,073 |
| Immigrants | Immigrants | 61.3 /100 | #167 | Good $85,818 |
| Icelanders | 61.0 /100 | #168 | Good $85,797 |
| Colombians | 59.7 /100 | #169 | Average $85,716 |
| Swiss | 59.2 /100 | #170 | Average $85,681 |
| Immigrants | South America | 58.1 /100 | #171 | Average $85,611 |
| Slovenes | 57.4 /100 | #172 | Average $85,562 |
| Immigrants | Cameroon | 53.4 /100 | #173 | Average $85,314 |
| Scottish | 50.0 /100 | #174 | Average $85,101 |
| Immigrants | Costa Rica | 49.2 /100 | #175 | Average $85,054 |
| Alsatians | 49.2 /100 | #176 | Average $85,053 |
| Immigrants | Eritrea | 48.8 /100 | #177 | Average $85,025 |
| Czechoslovakians | 47.8 /100 | #178 | Average $84,965 |