Peruvian vs Paraguayan Median Household Income
COMPARE
Peruvian
Paraguayan
Median Household Income
Median Household Income Comparison
Peruvians
Paraguayans
$90,261
MEDIAN HOUSEHOLD INCOME
96.5/ 100
METRIC RATING
113th/ 347
METRIC RANK
$95,737
MEDIAN HOUSEHOLD INCOME
99.9/ 100
METRIC RATING
53rd/ 347
METRIC RANK
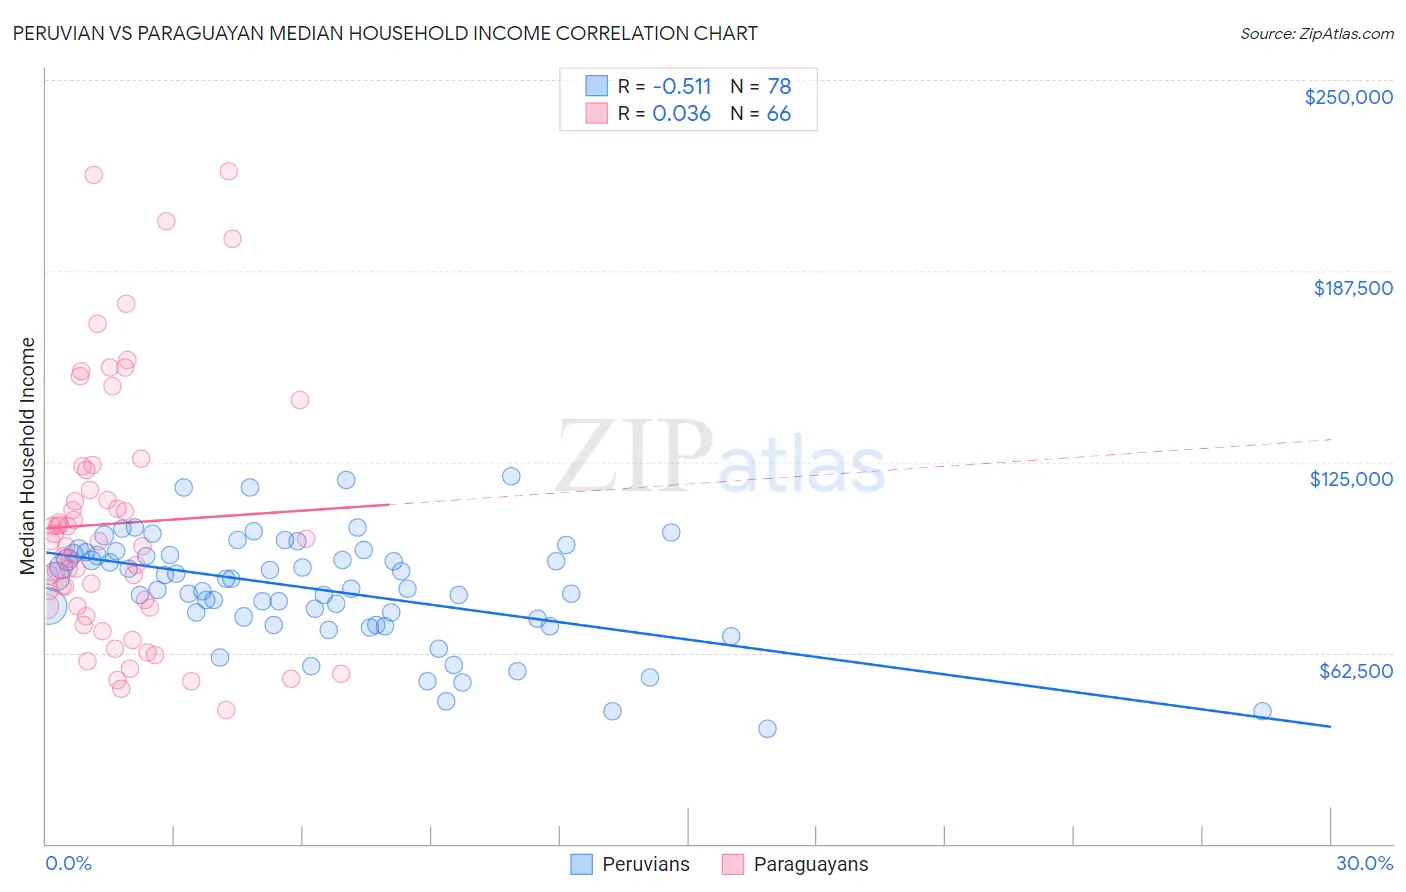
Peruvian vs Paraguayan Median Household Income Correlation Chart
The statistical analysis conducted on geographies consisting of 362,893,410 people shows a substantial negative correlation between the proportion of Peruvians and median household income in the United States with a correlation coefficient (R) of -0.511 and weighted average of $90,261. Similarly, the statistical analysis conducted on geographies consisting of 95,096,064 people shows no correlation between the proportion of Paraguayans and median household income in the United States with a correlation coefficient (R) of 0.036 and weighted average of $95,737, a difference of 6.1%.
Median Household Income Correlation Summary
| Measurement | Peruvian | Paraguayan |
| Minimum | $37,557 | $43,906 |
| Maximum | $120,179 | $220,060 |
| Range | $82,622 | $176,154 |
| Mean | $83,404 | $104,819 |
| Median | $85,145 | $98,291 |
| Interquartile 25% (IQ1) | $73,839 | $77,788 |
| Interquartile 75% (IQ3) | $95,038 | $122,293 |
| Interquartile Range (IQR) | $21,199 | $44,505 |
| Standard Deviation (Sample) | $17,709 | $41,190 |
| Standard Deviation (Population) | $17,595 | $40,877 |
Similar Demographics by Median Household Income
Demographics Similar to Peruvians by Median Household Income
In terms of median household income, the demographic groups most similar to Peruvians are Northern European ($90,446, a difference of 0.20%), Immigrants from Northern Africa ($90,026, a difference of 0.26%), Immigrants from Western Asia ($90,005, a difference of 0.28%), Immigrants from Poland ($90,549, a difference of 0.32%), and Palestinian ($90,574, a difference of 0.35%).
| Demographics | Rating | Rank | Median Household Income |
| Macedonians | 97.4 /100 | #106 | Exceptional $90,761 |
| Croatians | 97.3 /100 | #107 | Exceptional $90,685 |
| Zimbabweans | 97.2 /100 | #108 | Exceptional $90,618 |
| Chileans | 97.2 /100 | #109 | Exceptional $90,605 |
| Palestinians | 97.1 /100 | #110 | Exceptional $90,574 |
| Immigrants | Poland | 97.1 /100 | #111 | Exceptional $90,549 |
| Northern Europeans | 96.9 /100 | #112 | Exceptional $90,446 |
| Peruvians | 96.5 /100 | #113 | Exceptional $90,261 |
| Immigrants | Northern Africa | 95.9 /100 | #114 | Exceptional $90,026 |
| Immigrants | Western Asia | 95.9 /100 | #115 | Exceptional $90,005 |
| Native Hawaiians | 95.7 /100 | #116 | Exceptional $89,919 |
| Taiwanese | 95.6 /100 | #117 | Exceptional $89,900 |
| Syrians | 95.4 /100 | #118 | Exceptional $89,830 |
| Albanians | 95.2 /100 | #119 | Exceptional $89,744 |
| Immigrants | North Macedonia | 95.2 /100 | #120 | Exceptional $89,741 |
Demographics Similar to Paraguayans by Median Household Income
In terms of median household income, the demographic groups most similar to Paraguayans are Immigrants from South Africa ($95,800, a difference of 0.070%), Egyptian ($95,673, a difference of 0.070%), Estonian ($95,930, a difference of 0.20%), Immigrants from Czechoslovakia ($95,319, a difference of 0.44%), and Immigrants from Austria ($95,277, a difference of 0.48%).
| Demographics | Rating | Rank | Median Household Income |
| Australians | 99.9 /100 | #46 | Exceptional $96,490 |
| Immigrants | Russia | 99.9 /100 | #47 | Exceptional $96,378 |
| Cambodians | 99.9 /100 | #48 | Exceptional $96,324 |
| Immigrants | Malaysia | 99.9 /100 | #49 | Exceptional $96,292 |
| Bulgarians | 99.9 /100 | #50 | Exceptional $96,290 |
| Estonians | 99.9 /100 | #51 | Exceptional $95,930 |
| Immigrants | South Africa | 99.9 /100 | #52 | Exceptional $95,800 |
| Paraguayans | 99.9 /100 | #53 | Exceptional $95,737 |
| Egyptians | 99.9 /100 | #54 | Exceptional $95,673 |
| Immigrants | Czechoslovakia | 99.9 /100 | #55 | Exceptional $95,319 |
| Immigrants | Austria | 99.9 /100 | #56 | Exceptional $95,277 |
| New Zealanders | 99.8 /100 | #57 | Exceptional $95,146 |
| Soviet Union | 99.8 /100 | #58 | Exceptional $95,098 |
| Immigrants | Europe | 99.8 /100 | #59 | Exceptional $95,032 |
| Koreans | 99.8 /100 | #60 | Exceptional $95,018 |