Russian vs Immigrants from Jordan Median Household Income
COMPARE
Russian
Immigrants from Jordan
Median Household Income
Median Household Income Comparison
Russians
Immigrants from Jordan
$98,008
MEDIAN HOUSEHOLD INCOME
100.0/ 100
METRIC RATING
34th/ 347
METRIC RANK
$89,412
MEDIAN HOUSEHOLD INCOME
94.1/ 100
METRIC RATING
124th/ 347
METRIC RANK
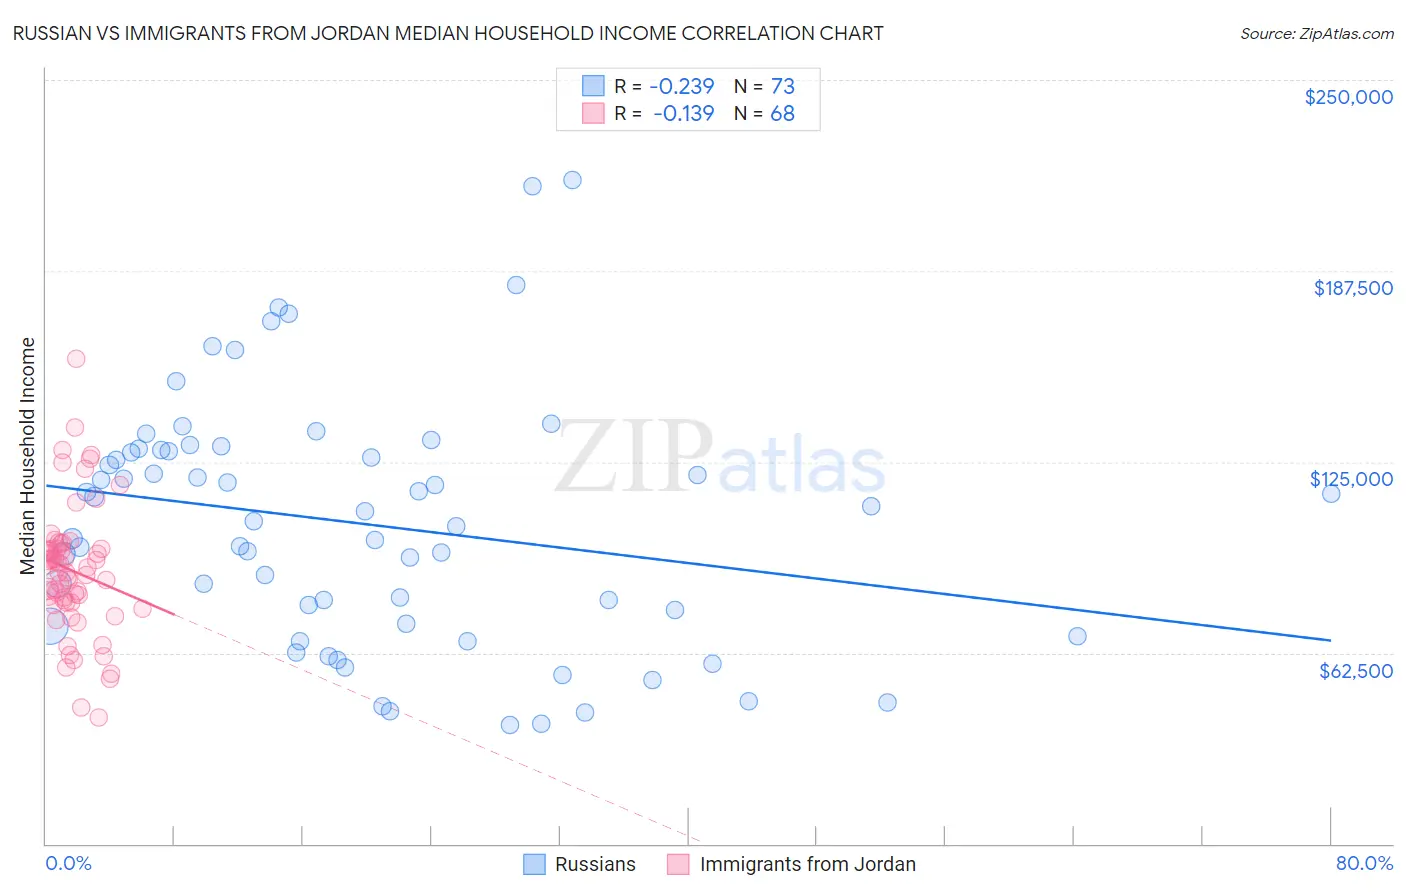
Russian vs Immigrants from Jordan Median Household Income Correlation Chart
The statistical analysis conducted on geographies consisting of 511,515,990 people shows a weak negative correlation between the proportion of Russians and median household income in the United States with a correlation coefficient (R) of -0.239 and weighted average of $98,008. Similarly, the statistical analysis conducted on geographies consisting of 181,227,500 people shows a poor negative correlation between the proportion of Immigrants from Jordan and median household income in the United States with a correlation coefficient (R) of -0.139 and weighted average of $89,412, a difference of 9.6%.
Median Household Income Correlation Summary
| Measurement | Russian | Immigrants from Jordan |
| Minimum | $38,750 | $41,486 |
| Maximum | $217,375 | $158,906 |
| Range | $178,625 | $117,420 |
| Mean | $104,714 | $89,344 |
| Median | $105,523 | $89,581 |
| Interquartile 25% (IQ1) | $71,539 | $78,846 |
| Interquartile 75% (IQ3) | $128,679 | $96,669 |
| Interquartile Range (IQR) | $57,140 | $17,823 |
| Standard Deviation (Sample) | $40,584 | $21,166 |
| Standard Deviation (Population) | $40,305 | $21,010 |
Similar Demographics by Median Household Income
Demographics Similar to Russians by Median Household Income
In terms of median household income, the demographic groups most similar to Russians are Immigrants from Switzerland ($97,979, a difference of 0.030%), Immigrants from Pakistan ($97,528, a difference of 0.49%), Chinese ($98,496, a difference of 0.50%), Immigrants from Denmark ($98,510, a difference of 0.51%), and Latvian ($97,311, a difference of 0.72%).
| Demographics | Rating | Rank | Median Household Income |
| Bhutanese | 100.0 /100 | #27 | Exceptional $100,151 |
| Immigrants | Sri Lanka | 100.0 /100 | #28 | Exceptional $99,943 |
| Immigrants | Asia | 100.0 /100 | #29 | Exceptional $99,933 |
| Immigrants | Northern Europe | 100.0 /100 | #30 | Exceptional $99,813 |
| Turks | 100.0 /100 | #31 | Exceptional $99,389 |
| Immigrants | Denmark | 100.0 /100 | #32 | Exceptional $98,510 |
| Chinese | 100.0 /100 | #33 | Exceptional $98,496 |
| Russians | 100.0 /100 | #34 | Exceptional $98,008 |
| Immigrants | Switzerland | 100.0 /100 | #35 | Exceptional $97,979 |
| Immigrants | Pakistan | 100.0 /100 | #36 | Exceptional $97,528 |
| Latvians | 100.0 /100 | #37 | Exceptional $97,311 |
| Immigrants | Indonesia | 100.0 /100 | #38 | Exceptional $97,297 |
| Afghans | 100.0 /100 | #39 | Exceptional $97,026 |
| Maltese | 100.0 /100 | #40 | Exceptional $97,015 |
| Immigrants | Turkey | 100.0 /100 | #41 | Exceptional $96,964 |
Demographics Similar to Immigrants from Jordan by Median Household Income
In terms of median household income, the demographic groups most similar to Immigrants from Jordan are Immigrants from Zimbabwe ($89,496, a difference of 0.090%), Immigrants from Kuwait ($89,263, a difference of 0.17%), Ethiopian ($89,640, a difference of 0.25%), Pakistani ($89,638, a difference of 0.25%), and Immigrants from Oceania ($89,100, a difference of 0.35%).
| Demographics | Rating | Rank | Median Household Income |
| Taiwanese | 95.6 /100 | #117 | Exceptional $89,900 |
| Syrians | 95.4 /100 | #118 | Exceptional $89,830 |
| Albanians | 95.2 /100 | #119 | Exceptional $89,744 |
| Immigrants | North Macedonia | 95.2 /100 | #120 | Exceptional $89,741 |
| Ethiopians | 94.9 /100 | #121 | Exceptional $89,640 |
| Pakistanis | 94.8 /100 | #122 | Exceptional $89,638 |
| Immigrants | Zimbabwe | 94.4 /100 | #123 | Exceptional $89,496 |
| Immigrants | Jordan | 94.1 /100 | #124 | Exceptional $89,412 |
| Immigrants | Kuwait | 93.5 /100 | #125 | Exceptional $89,263 |
| Immigrants | Oceania | 92.9 /100 | #126 | Exceptional $89,100 |
| Immigrants | Peru | 92.5 /100 | #127 | Exceptional $89,010 |
| Portuguese | 92.3 /100 | #128 | Exceptional $88,976 |
| Brazilians | 92.1 /100 | #129 | Exceptional $88,934 |
| British | 92.0 /100 | #130 | Exceptional $88,914 |
| Immigrants | Syria | 91.4 /100 | #131 | Exceptional $88,792 |