Peruvian vs Immigrants from Ghana Median Household Income
COMPARE
Peruvian
Immigrants from Ghana
Median Household Income
Median Household Income Comparison
Peruvians
Immigrants from Ghana
$90,261
MEDIAN HOUSEHOLD INCOME
96.5/ 100
METRIC RATING
113th/ 347
METRIC RANK
$81,489
MEDIAN HOUSEHOLD INCOME
9.0/ 100
METRIC RATING
221st/ 347
METRIC RANK
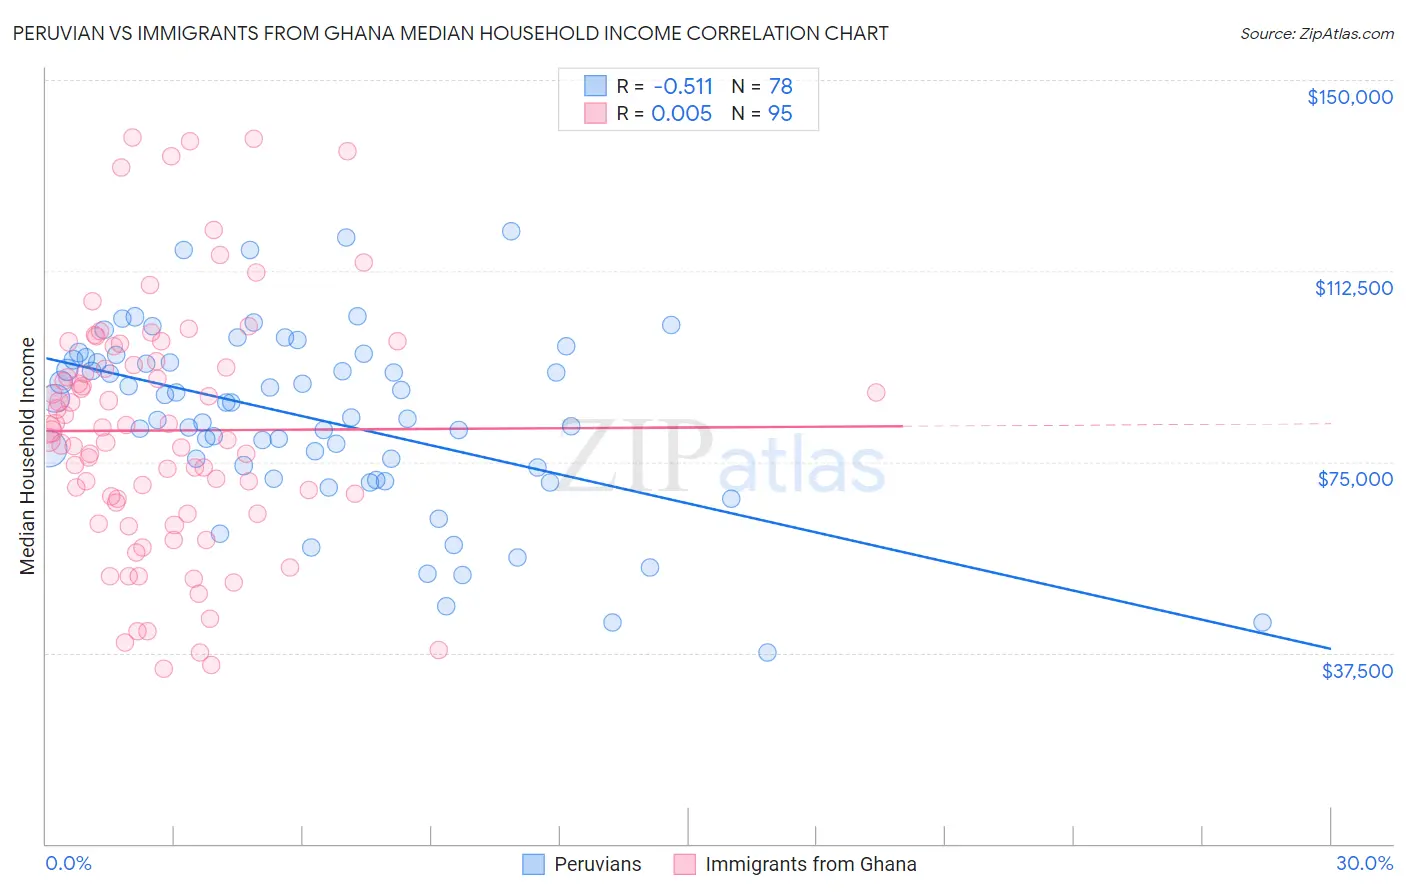
Peruvian vs Immigrants from Ghana Median Household Income Correlation Chart
The statistical analysis conducted on geographies consisting of 362,893,410 people shows a substantial negative correlation between the proportion of Peruvians and median household income in the United States with a correlation coefficient (R) of -0.511 and weighted average of $90,261. Similarly, the statistical analysis conducted on geographies consisting of 199,784,563 people shows no correlation between the proportion of Immigrants from Ghana and median household income in the United States with a correlation coefficient (R) of 0.005 and weighted average of $81,489, a difference of 10.8%.
Median Household Income Correlation Summary
| Measurement | Peruvian | Immigrants from Ghana |
| Minimum | $37,557 | $34,375 |
| Maximum | $120,179 | $138,703 |
| Range | $82,622 | $104,328 |
| Mean | $83,404 | $81,173 |
| Median | $85,145 | $81,072 |
| Interquartile 25% (IQ1) | $73,839 | $64,873 |
| Interquartile 75% (IQ3) | $95,038 | $94,696 |
| Interquartile Range (IQR) | $21,199 | $29,822 |
| Standard Deviation (Sample) | $17,709 | $24,293 |
| Standard Deviation (Population) | $17,595 | $24,164 |
Similar Demographics by Median Household Income
Demographics Similar to Peruvians by Median Household Income
In terms of median household income, the demographic groups most similar to Peruvians are Northern European ($90,446, a difference of 0.20%), Immigrants from Northern Africa ($90,026, a difference of 0.26%), Immigrants from Western Asia ($90,005, a difference of 0.28%), Immigrants from Poland ($90,549, a difference of 0.32%), and Palestinian ($90,574, a difference of 0.35%).
| Demographics | Rating | Rank | Median Household Income |
| Macedonians | 97.4 /100 | #106 | Exceptional $90,761 |
| Croatians | 97.3 /100 | #107 | Exceptional $90,685 |
| Zimbabweans | 97.2 /100 | #108 | Exceptional $90,618 |
| Chileans | 97.2 /100 | #109 | Exceptional $90,605 |
| Palestinians | 97.1 /100 | #110 | Exceptional $90,574 |
| Immigrants | Poland | 97.1 /100 | #111 | Exceptional $90,549 |
| Northern Europeans | 96.9 /100 | #112 | Exceptional $90,446 |
| Peruvians | 96.5 /100 | #113 | Exceptional $90,261 |
| Immigrants | Northern Africa | 95.9 /100 | #114 | Exceptional $90,026 |
| Immigrants | Western Asia | 95.9 /100 | #115 | Exceptional $90,005 |
| Native Hawaiians | 95.7 /100 | #116 | Exceptional $89,919 |
| Taiwanese | 95.6 /100 | #117 | Exceptional $89,900 |
| Syrians | 95.4 /100 | #118 | Exceptional $89,830 |
| Albanians | 95.2 /100 | #119 | Exceptional $89,744 |
| Immigrants | North Macedonia | 95.2 /100 | #120 | Exceptional $89,741 |
Demographics Similar to Immigrants from Ghana by Median Household Income
In terms of median household income, the demographic groups most similar to Immigrants from Ghana are Immigrants from Venezuela ($81,506, a difference of 0.020%), Nigerian ($81,725, a difference of 0.29%), Immigrants from Nigeria ($81,236, a difference of 0.31%), Immigrants from El Salvador ($81,213, a difference of 0.34%), and Malaysian ($81,064, a difference of 0.52%).
| Demographics | Rating | Rank | Median Household Income |
| Panamanians | 14.0 /100 | #214 | Poor $82,272 |
| Vietnamese | 13.8 /100 | #215 | Poor $82,248 |
| Yugoslavians | 13.3 /100 | #216 | Poor $82,186 |
| Ecuadorians | 12.5 /100 | #217 | Poor $82,070 |
| Whites/Caucasians | 12.2 /100 | #218 | Poor $82,029 |
| Nigerians | 10.3 /100 | #219 | Poor $81,725 |
| Immigrants | Venezuela | 9.0 /100 | #220 | Tragic $81,506 |
| Immigrants | Ghana | 9.0 /100 | #221 | Tragic $81,489 |
| Immigrants | Nigeria | 7.7 /100 | #222 | Tragic $81,236 |
| Immigrants | El Salvador | 7.6 /100 | #223 | Tragic $81,213 |
| Malaysians | 7.0 /100 | #224 | Tragic $81,064 |
| Scotch-Irish | 6.6 /100 | #225 | Tragic $80,972 |
| Immigrants | Panama | 6.2 /100 | #226 | Tragic $80,873 |
| Guyanese | 5.7 /100 | #227 | Tragic $80,734 |
| Immigrants | Bangladesh | 5.7 /100 | #228 | Tragic $80,722 |