Paiute vs Immigrants from Colombia 3rd Grade
COMPARE
Paiute
Immigrants from Colombia
3rd Grade
3rd Grade Comparison
Paiute
Immigrants from Colombia
97.6%
3RD GRADE
16.7/ 100
METRIC RATING
203rd/ 347
METRIC RANK
97.3%
3RD GRADE
0.5/ 100
METRIC RATING
257th/ 347
METRIC RANK
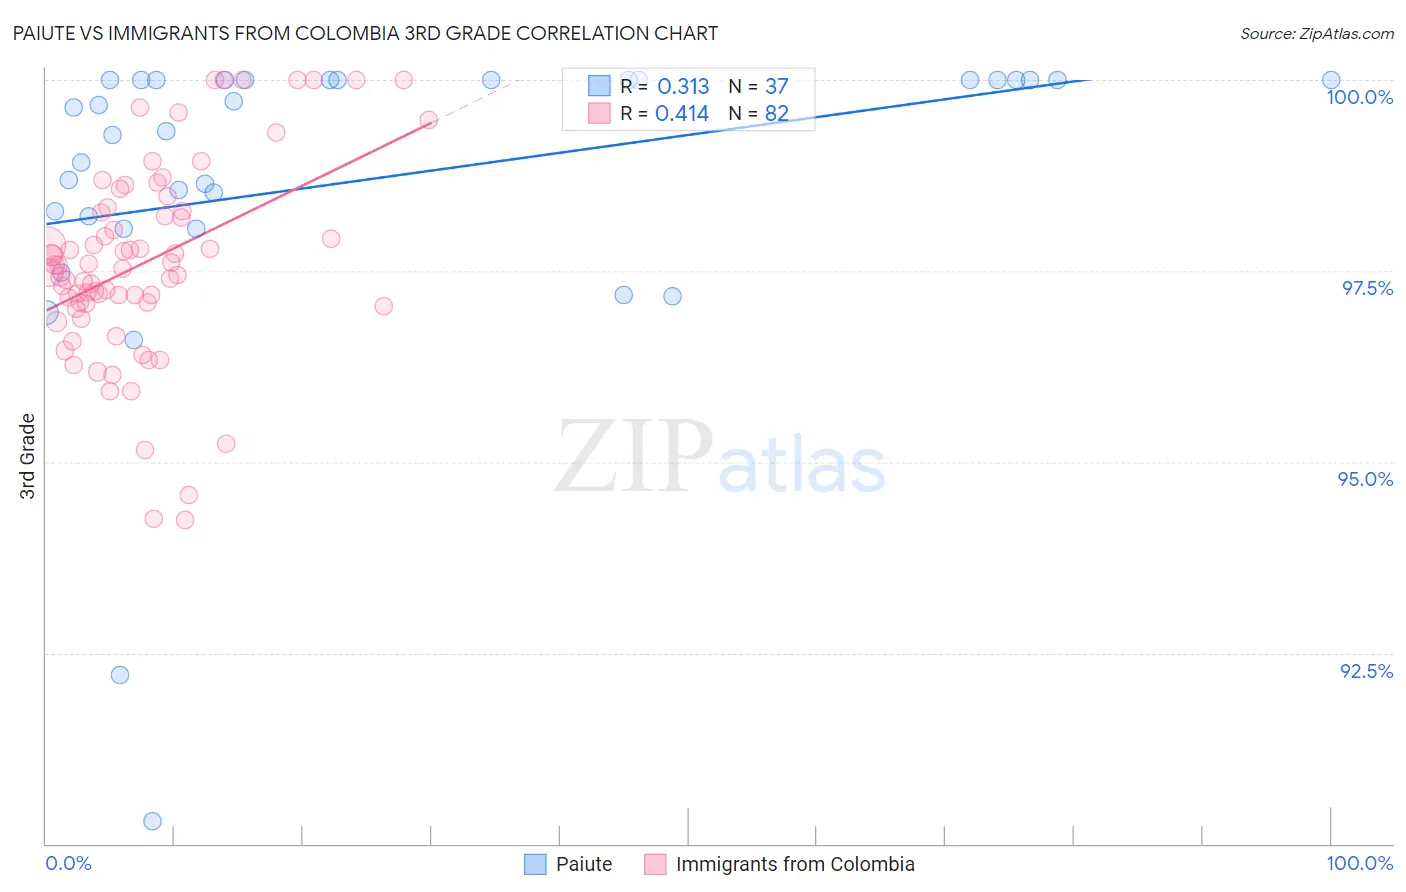
Paiute vs Immigrants from Colombia 3rd Grade Correlation Chart
The statistical analysis conducted on geographies consisting of 58,402,332 people shows a mild positive correlation between the proportion of Paiute and percentage of population with at least 3rd grade education in the United States with a correlation coefficient (R) of 0.313 and weighted average of 97.6%. Similarly, the statistical analysis conducted on geographies consisting of 378,643,693 people shows a moderate positive correlation between the proportion of Immigrants from Colombia and percentage of population with at least 3rd grade education in the United States with a correlation coefficient (R) of 0.414 and weighted average of 97.3%, a difference of 0.31%.
3rd Grade Correlation Summary
| Measurement | Paiute | Immigrants from Colombia |
| Minimum | 90.3% | 94.2% |
| Maximum | 100.0% | 100.0% |
| Range | 9.7% | 5.8% |
| Mean | 98.7% | 97.6% |
| Median | 99.6% | 97.5% |
| Interquartile 25% (IQ1) | 98.1% | 97.1% |
| Interquartile 75% (IQ3) | 100.0% | 98.3% |
| Interquartile Range (IQR) | 1.9% | 1.2% |
| Standard Deviation (Sample) | 2.1% | 1.3% |
| Standard Deviation (Population) | 2.1% | 1.3% |
Similar Demographics by 3rd Grade
Demographics Similar to Paiute by 3rd Grade
In terms of 3rd grade, the demographic groups most similar to Paiute are Immigrants from Chile (97.6%, a difference of 0.0%), Immigrants from Southern Europe (97.6%, a difference of 0.010%), African (97.6%, a difference of 0.010%), Immigrants from Northern Africa (97.6%, a difference of 0.020%), and Immigrants from Ukraine (97.7%, a difference of 0.030%).
| Demographics | Rating | Rank | 3rd Grade |
| Paraguayans | 26.2 /100 | #196 | Fair 97.7% |
| Hawaiians | 25.7 /100 | #197 | Fair 97.7% |
| Guamanians/Chamorros | 23.6 /100 | #198 | Fair 97.7% |
| Immigrants | Ukraine | 22.7 /100 | #199 | Fair 97.7% |
| Immigrants | Albania | 22.6 /100 | #200 | Fair 97.7% |
| Immigrants | Lebanon | 21.7 /100 | #201 | Fair 97.7% |
| Immigrants | Southern Europe | 17.7 /100 | #202 | Poor 97.6% |
| Paiute | 16.7 /100 | #203 | Poor 97.6% |
| Immigrants | Chile | 16.5 /100 | #204 | Poor 97.6% |
| Africans | 14.5 /100 | #205 | Poor 97.6% |
| Immigrants | Northern Africa | 13.0 /100 | #206 | Poor 97.6% |
| Tohono O'odham | 12.5 /100 | #207 | Poor 97.6% |
| Immigrants | Zaire | 11.9 /100 | #208 | Poor 97.6% |
| Costa Ricans | 9.6 /100 | #209 | Tragic 97.6% |
| Immigrants | Oceania | 9.5 /100 | #210 | Tragic 97.6% |
Demographics Similar to Immigrants from Colombia by 3rd Grade
In terms of 3rd grade, the demographic groups most similar to Immigrants from Colombia are Bolivian (97.3%, a difference of 0.010%), Immigrants from Congo (97.3%, a difference of 0.010%), Immigrants from Liberia (97.3%, a difference of 0.010%), Armenian (97.3%, a difference of 0.020%), and Immigrants from Ethiopia (97.3%, a difference of 0.020%).
| Demographics | Rating | Rank | 3rd Grade |
| Immigrants | Middle Africa | 0.9 /100 | #250 | Tragic 97.4% |
| Immigrants | Asia | 0.8 /100 | #251 | Tragic 97.4% |
| Peruvians | 0.8 /100 | #252 | Tragic 97.4% |
| Immigrants | Africa | 0.8 /100 | #253 | Tragic 97.4% |
| Jamaicans | 0.7 /100 | #254 | Tragic 97.4% |
| Bolivians | 0.6 /100 | #255 | Tragic 97.3% |
| Immigrants | Congo | 0.6 /100 | #256 | Tragic 97.3% |
| Immigrants | Colombia | 0.5 /100 | #257 | Tragic 97.3% |
| Immigrants | Liberia | 0.5 /100 | #258 | Tragic 97.3% |
| Armenians | 0.4 /100 | #259 | Tragic 97.3% |
| Immigrants | Ethiopia | 0.4 /100 | #260 | Tragic 97.3% |
| Immigrants | South America | 0.4 /100 | #261 | Tragic 97.3% |
| Immigrants | Sierra Leone | 0.4 /100 | #262 | Tragic 97.3% |
| Taiwanese | 0.3 /100 | #263 | Tragic 97.3% |
| West Indians | 0.3 /100 | #264 | Tragic 97.3% |