Ottawa vs Houma Median Earnings
COMPARE
Ottawa
Houma
Median Earnings
Median Earnings Comparison
Ottawa
Houma
$39,721
MEDIAN EARNINGS
0.0/ 100
METRIC RATING
324th/ 347
METRIC RANK
$38,949
MEDIAN EARNINGS
0.0/ 100
METRIC RATING
333rd/ 347
METRIC RANK
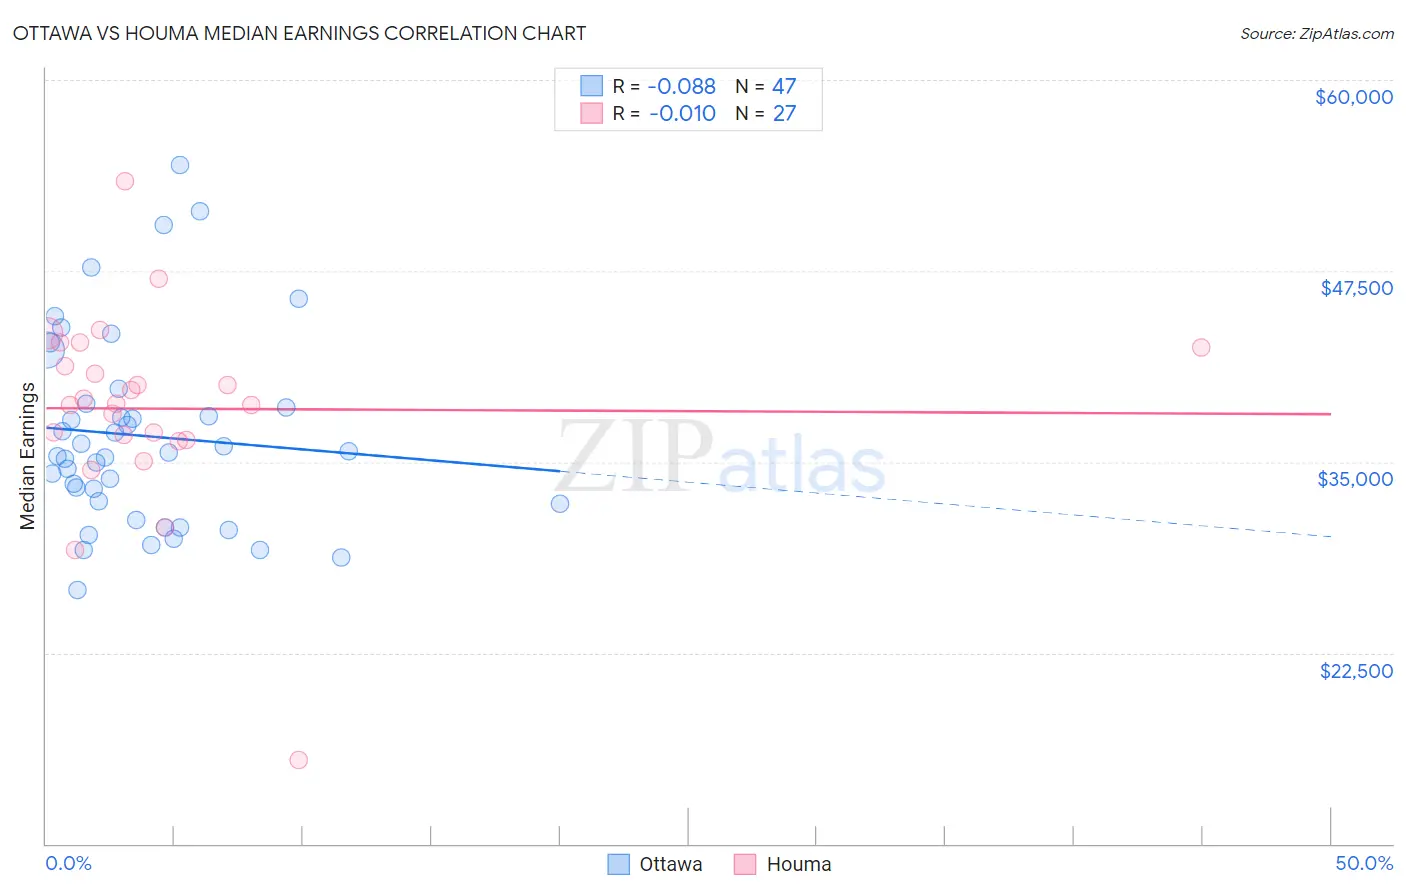
Ottawa vs Houma Median Earnings Correlation Chart
The statistical analysis conducted on geographies consisting of 49,956,035 people shows a slight negative correlation between the proportion of Ottawa and median earnings in the United States with a correlation coefficient (R) of -0.088 and weighted average of $39,721. Similarly, the statistical analysis conducted on geographies consisting of 36,796,366 people shows no correlation between the proportion of Houma and median earnings in the United States with a correlation coefficient (R) of -0.010 and weighted average of $38,949, a difference of 2.0%.
Median Earnings Correlation Summary
| Measurement | Ottawa | Houma |
| Minimum | $26,644 | $15,495 |
| Maximum | $54,444 | $53,358 |
| Range | $27,800 | $37,863 |
| Mean | $36,701 | $38,485 |
| Median | $35,608 | $38,771 |
| Interquartile 25% (IQ1) | $32,292 | $36,392 |
| Interquartile 75% (IQ3) | $38,794 | $42,500 |
| Interquartile Range (IQR) | $6,502 | $6,108 |
| Standard Deviation (Sample) | $6,309 | $6,619 |
| Standard Deviation (Population) | $6,241 | $6,495 |
Demographics Similar to Ottawa and Houma by Median Earnings
In terms of median earnings, the demographic groups most similar to Ottawa are Bahamian ($39,735, a difference of 0.040%), Immigrants from Central America ($39,762, a difference of 0.10%), Creek ($39,648, a difference of 0.18%), Mexican ($39,834, a difference of 0.29%), and Immigrants from Bahamas ($39,861, a difference of 0.35%). Similarly, the demographic groups most similar to Houma are Spanish American Indian ($38,907, a difference of 0.11%), Native/Alaskan ($38,896, a difference of 0.14%), Yakama ($39,107, a difference of 0.41%), Immigrants from Mexico ($39,114, a difference of 0.42%), and Immigrants from Congo ($39,169, a difference of 0.57%).
| Demographics | Rating | Rank | Median Earnings |
| Dutch West Indians | 0.0 /100 | #318 | Tragic $40,107 |
| Blacks/African Americans | 0.0 /100 | #319 | Tragic $40,085 |
| Immigrants | Bahamas | 0.0 /100 | #320 | Tragic $39,861 |
| Mexicans | 0.0 /100 | #321 | Tragic $39,834 |
| Immigrants | Central America | 0.0 /100 | #322 | Tragic $39,762 |
| Bahamians | 0.0 /100 | #323 | Tragic $39,735 |
| Ottawa | 0.0 /100 | #324 | Tragic $39,721 |
| Creek | 0.0 /100 | #325 | Tragic $39,648 |
| Immigrants | Yemen | 0.0 /100 | #326 | Tragic $39,540 |
| Yuman | 0.0 /100 | #327 | Tragic $39,523 |
| Sioux | 0.0 /100 | #328 | Tragic $39,448 |
| Kiowa | 0.0 /100 | #329 | Tragic $39,232 |
| Immigrants | Congo | 0.0 /100 | #330 | Tragic $39,169 |
| Immigrants | Mexico | 0.0 /100 | #331 | Tragic $39,114 |
| Yakama | 0.0 /100 | #332 | Tragic $39,107 |
| Houma | 0.0 /100 | #333 | Tragic $38,949 |
| Spanish American Indians | 0.0 /100 | #334 | Tragic $38,907 |
| Natives/Alaskans | 0.0 /100 | #335 | Tragic $38,896 |
| Crow | 0.0 /100 | #336 | Tragic $38,707 |
| Immigrants | Cuba | 0.0 /100 | #337 | Tragic $38,426 |
| Pima | 0.0 /100 | #338 | Tragic $38,285 |