Ottawa vs Immigrants from Lithuania Median Earnings
COMPARE
Ottawa
Immigrants from Lithuania
Median Earnings
Median Earnings Comparison
Ottawa
Immigrants from Lithuania
$39,721
MEDIAN EARNINGS
0.0/ 100
METRIC RATING
324th/ 347
METRIC RANK
$52,769
MEDIAN EARNINGS
100.0/ 100
METRIC RATING
41st/ 347
METRIC RANK
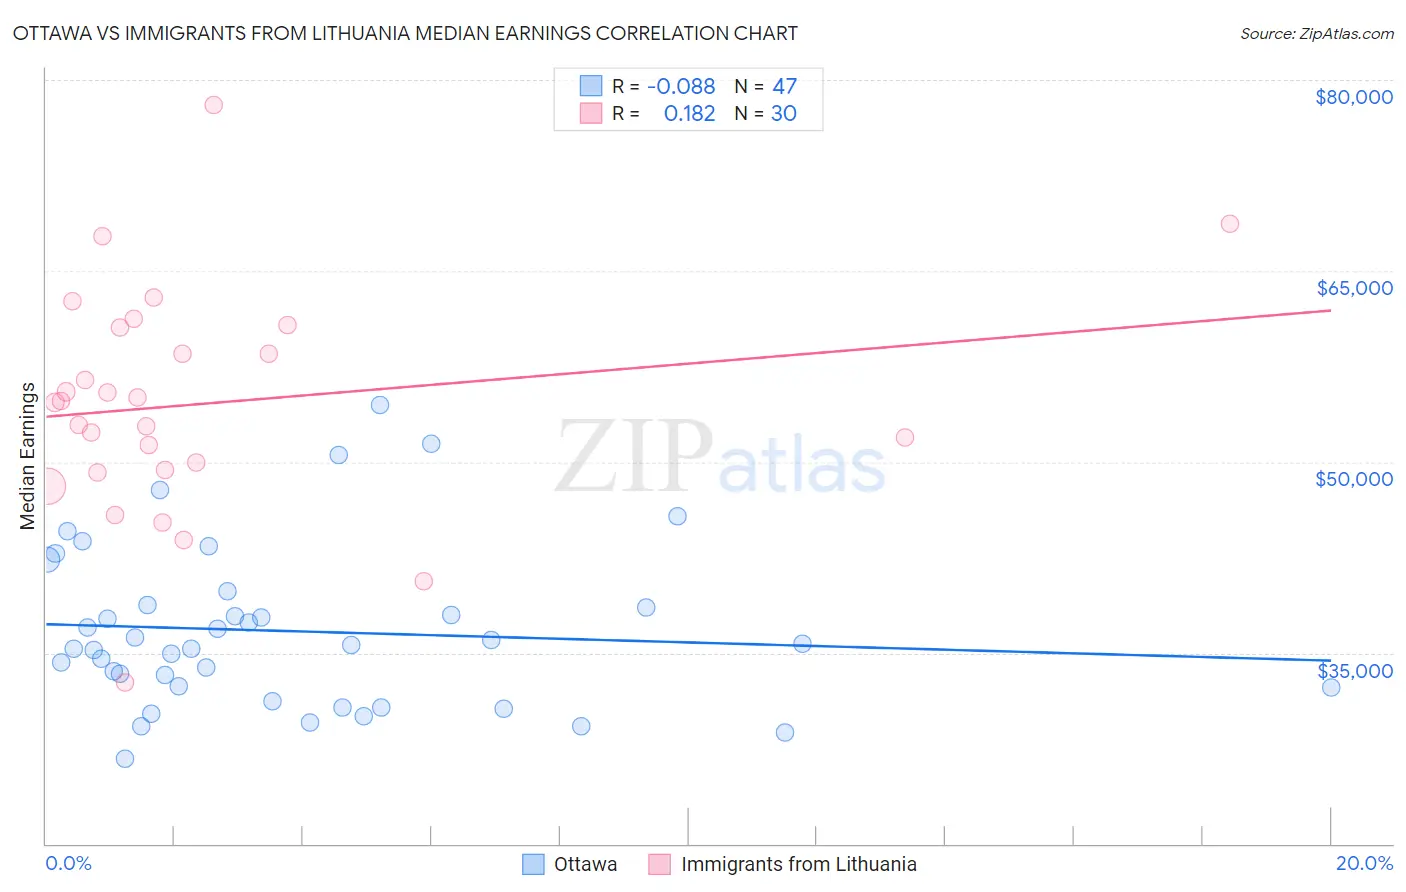
Ottawa vs Immigrants from Lithuania Median Earnings Correlation Chart
The statistical analysis conducted on geographies consisting of 49,956,035 people shows a slight negative correlation between the proportion of Ottawa and median earnings in the United States with a correlation coefficient (R) of -0.088 and weighted average of $39,721. Similarly, the statistical analysis conducted on geographies consisting of 117,724,669 people shows a poor positive correlation between the proportion of Immigrants from Lithuania and median earnings in the United States with a correlation coefficient (R) of 0.182 and weighted average of $52,769, a difference of 32.9%.
Median Earnings Correlation Summary
| Measurement | Ottawa | Immigrants from Lithuania |
| Minimum | $26,644 | $32,646 |
| Maximum | $54,444 | $78,046 |
| Range | $27,800 | $45,400 |
| Mean | $36,701 | $54,582 |
| Median | $35,608 | $54,749 |
| Interquartile 25% (IQ1) | $32,292 | $49,388 |
| Interquartile 75% (IQ3) | $38,794 | $60,605 |
| Interquartile Range (IQR) | $6,502 | $11,217 |
| Standard Deviation (Sample) | $6,309 | $8,932 |
| Standard Deviation (Population) | $6,241 | $8,782 |
Similar Demographics by Median Earnings
Demographics Similar to Ottawa by Median Earnings
In terms of median earnings, the demographic groups most similar to Ottawa are Bahamian ($39,735, a difference of 0.040%), Immigrants from Central America ($39,762, a difference of 0.10%), Creek ($39,648, a difference of 0.18%), Mexican ($39,834, a difference of 0.29%), and Immigrants from Bahamas ($39,861, a difference of 0.35%).
| Demographics | Rating | Rank | Median Earnings |
| Fijians | 0.0 /100 | #317 | Tragic $40,193 |
| Dutch West Indians | 0.0 /100 | #318 | Tragic $40,107 |
| Blacks/African Americans | 0.0 /100 | #319 | Tragic $40,085 |
| Immigrants | Bahamas | 0.0 /100 | #320 | Tragic $39,861 |
| Mexicans | 0.0 /100 | #321 | Tragic $39,834 |
| Immigrants | Central America | 0.0 /100 | #322 | Tragic $39,762 |
| Bahamians | 0.0 /100 | #323 | Tragic $39,735 |
| Ottawa | 0.0 /100 | #324 | Tragic $39,721 |
| Creek | 0.0 /100 | #325 | Tragic $39,648 |
| Immigrants | Yemen | 0.0 /100 | #326 | Tragic $39,540 |
| Yuman | 0.0 /100 | #327 | Tragic $39,523 |
| Sioux | 0.0 /100 | #328 | Tragic $39,448 |
| Kiowa | 0.0 /100 | #329 | Tragic $39,232 |
| Immigrants | Congo | 0.0 /100 | #330 | Tragic $39,169 |
| Immigrants | Mexico | 0.0 /100 | #331 | Tragic $39,114 |
Demographics Similar to Immigrants from Lithuania by Median Earnings
In terms of median earnings, the demographic groups most similar to Immigrants from Lithuania are Israeli ($52,937, a difference of 0.32%), Immigrants from Turkey ($52,960, a difference of 0.36%), Latvian ($53,001, a difference of 0.44%), Maltese ($52,526, a difference of 0.46%), and Immigrants from Malaysia ($52,514, a difference of 0.49%).
| Demographics | Rating | Rank | Median Earnings |
| Immigrants | Sri Lanka | 100.0 /100 | #34 | Exceptional $53,268 |
| Immigrants | Switzerland | 100.0 /100 | #35 | Exceptional $53,211 |
| Immigrants | Denmark | 100.0 /100 | #36 | Exceptional $53,186 |
| Immigrants | Belarus | 100.0 /100 | #37 | Exceptional $53,043 |
| Latvians | 100.0 /100 | #38 | Exceptional $53,001 |
| Immigrants | Turkey | 100.0 /100 | #39 | Exceptional $52,960 |
| Israelis | 100.0 /100 | #40 | Exceptional $52,937 |
| Immigrants | Lithuania | 100.0 /100 | #41 | Exceptional $52,769 |
| Maltese | 100.0 /100 | #42 | Exceptional $52,526 |
| Immigrants | Malaysia | 100.0 /100 | #43 | Exceptional $52,514 |
| Bulgarians | 100.0 /100 | #44 | Exceptional $52,512 |
| Immigrants | Czechoslovakia | 100.0 /100 | #45 | Exceptional $52,361 |
| Bhutanese | 100.0 /100 | #46 | Exceptional $52,297 |
| Australians | 100.0 /100 | #47 | Exceptional $52,294 |
| Immigrants | Europe | 100.0 /100 | #48 | Exceptional $52,195 |