Ottawa vs Pueblo Median Earnings
COMPARE
Ottawa
Pueblo
Median Earnings
Median Earnings Comparison
Ottawa
Pueblo
$39,721
MEDIAN EARNINGS
0.0/ 100
METRIC RATING
324th/ 347
METRIC RANK
$36,859
MEDIAN EARNINGS
0.0/ 100
METRIC RATING
343rd/ 347
METRIC RANK
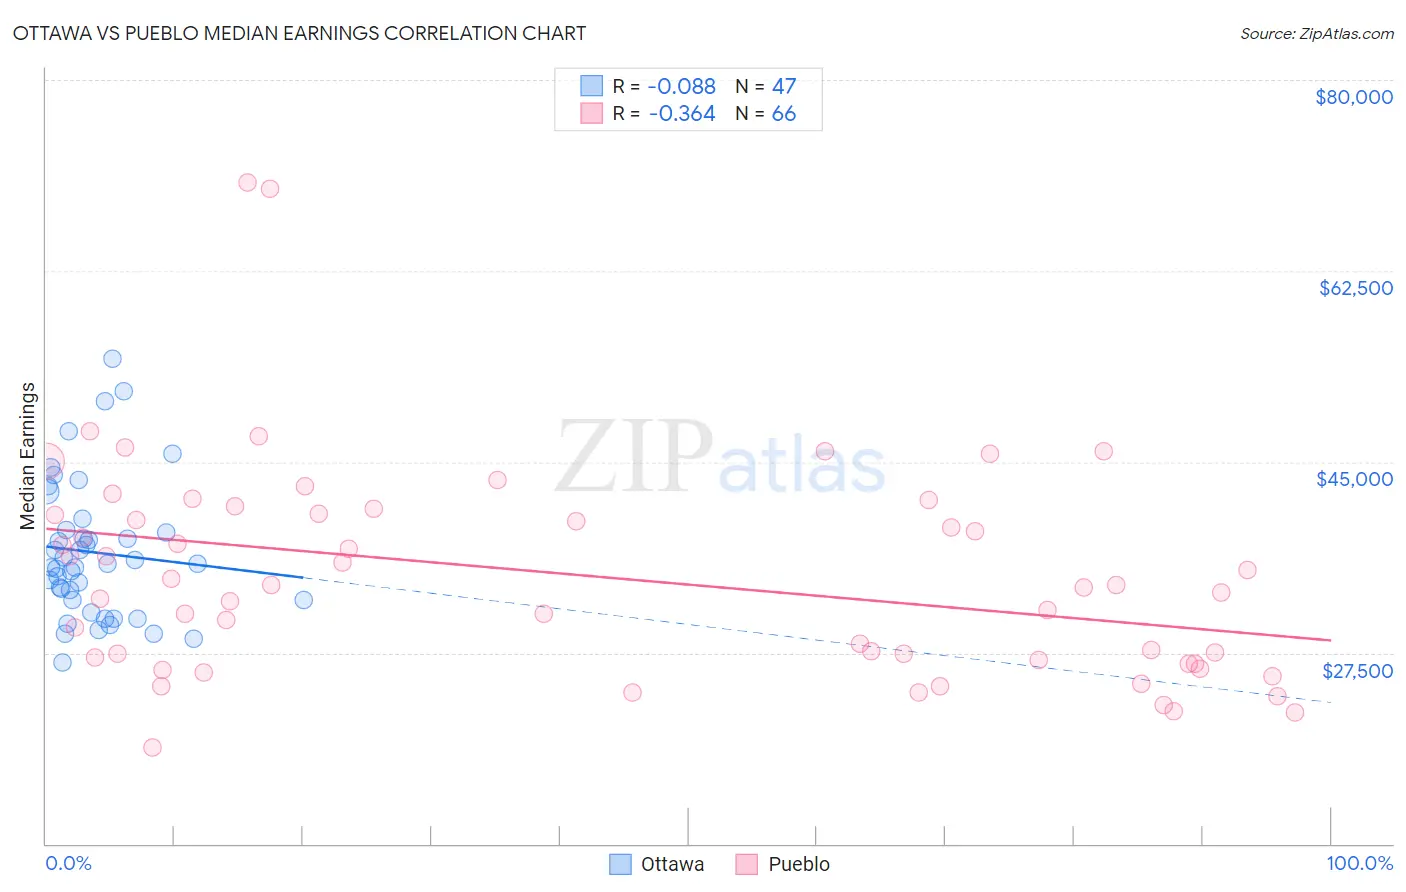
Ottawa vs Pueblo Median Earnings Correlation Chart
The statistical analysis conducted on geographies consisting of 49,956,035 people shows a slight negative correlation between the proportion of Ottawa and median earnings in the United States with a correlation coefficient (R) of -0.088 and weighted average of $39,721. Similarly, the statistical analysis conducted on geographies consisting of 120,073,661 people shows a mild negative correlation between the proportion of Pueblo and median earnings in the United States with a correlation coefficient (R) of -0.364 and weighted average of $36,859, a difference of 7.8%.
Median Earnings Correlation Summary
| Measurement | Ottawa | Pueblo |
| Minimum | $26,644 | $18,846 |
| Maximum | $54,444 | $70,625 |
| Range | $27,800 | $51,779 |
| Mean | $36,701 | $34,570 |
| Median | $35,608 | $33,598 |
| Interquartile 25% (IQ1) | $32,292 | $26,791 |
| Interquartile 75% (IQ3) | $38,794 | $40,227 |
| Interquartile Range (IQR) | $6,502 | $13,436 |
| Standard Deviation (Sample) | $6,309 | $9,914 |
| Standard Deviation (Population) | $6,241 | $9,839 |
Demographics Similar to Ottawa and Pueblo by Median Earnings
In terms of median earnings, the demographic groups most similar to Ottawa are Bahamian ($39,735, a difference of 0.040%), Creek ($39,648, a difference of 0.18%), Immigrants from Yemen ($39,540, a difference of 0.46%), Yuman ($39,523, a difference of 0.50%), and Sioux ($39,448, a difference of 0.69%). Similarly, the demographic groups most similar to Pueblo are Hopi ($36,871, a difference of 0.030%), Lumbee ($36,876, a difference of 0.050%), Navajo ($36,999, a difference of 0.38%), Menominee ($37,884, a difference of 2.8%), and Pima ($38,285, a difference of 3.9%).
| Demographics | Rating | Rank | Median Earnings |
| Bahamians | 0.0 /100 | #323 | Tragic $39,735 |
| Ottawa | 0.0 /100 | #324 | Tragic $39,721 |
| Creek | 0.0 /100 | #325 | Tragic $39,648 |
| Immigrants | Yemen | 0.0 /100 | #326 | Tragic $39,540 |
| Yuman | 0.0 /100 | #327 | Tragic $39,523 |
| Sioux | 0.0 /100 | #328 | Tragic $39,448 |
| Kiowa | 0.0 /100 | #329 | Tragic $39,232 |
| Immigrants | Congo | 0.0 /100 | #330 | Tragic $39,169 |
| Immigrants | Mexico | 0.0 /100 | #331 | Tragic $39,114 |
| Yakama | 0.0 /100 | #332 | Tragic $39,107 |
| Houma | 0.0 /100 | #333 | Tragic $38,949 |
| Spanish American Indians | 0.0 /100 | #334 | Tragic $38,907 |
| Natives/Alaskans | 0.0 /100 | #335 | Tragic $38,896 |
| Crow | 0.0 /100 | #336 | Tragic $38,707 |
| Immigrants | Cuba | 0.0 /100 | #337 | Tragic $38,426 |
| Pima | 0.0 /100 | #338 | Tragic $38,285 |
| Menominee | 0.0 /100 | #339 | Tragic $37,884 |
| Navajo | 0.0 /100 | #340 | Tragic $36,999 |
| Lumbee | 0.0 /100 | #341 | Tragic $36,876 |
| Hopi | 0.0 /100 | #342 | Tragic $36,871 |
| Pueblo | 0.0 /100 | #343 | Tragic $36,859 |