Ottawa vs Ukrainian Median Earnings
COMPARE
Ottawa
Ukrainian
Median Earnings
Median Earnings Comparison
Ottawa
Ukrainians
$39,721
MEDIAN EARNINGS
0.0/ 100
METRIC RATING
324th/ 347
METRIC RANK
$50,320
MEDIAN EARNINGS
99.6/ 100
METRIC RATING
80th/ 347
METRIC RANK
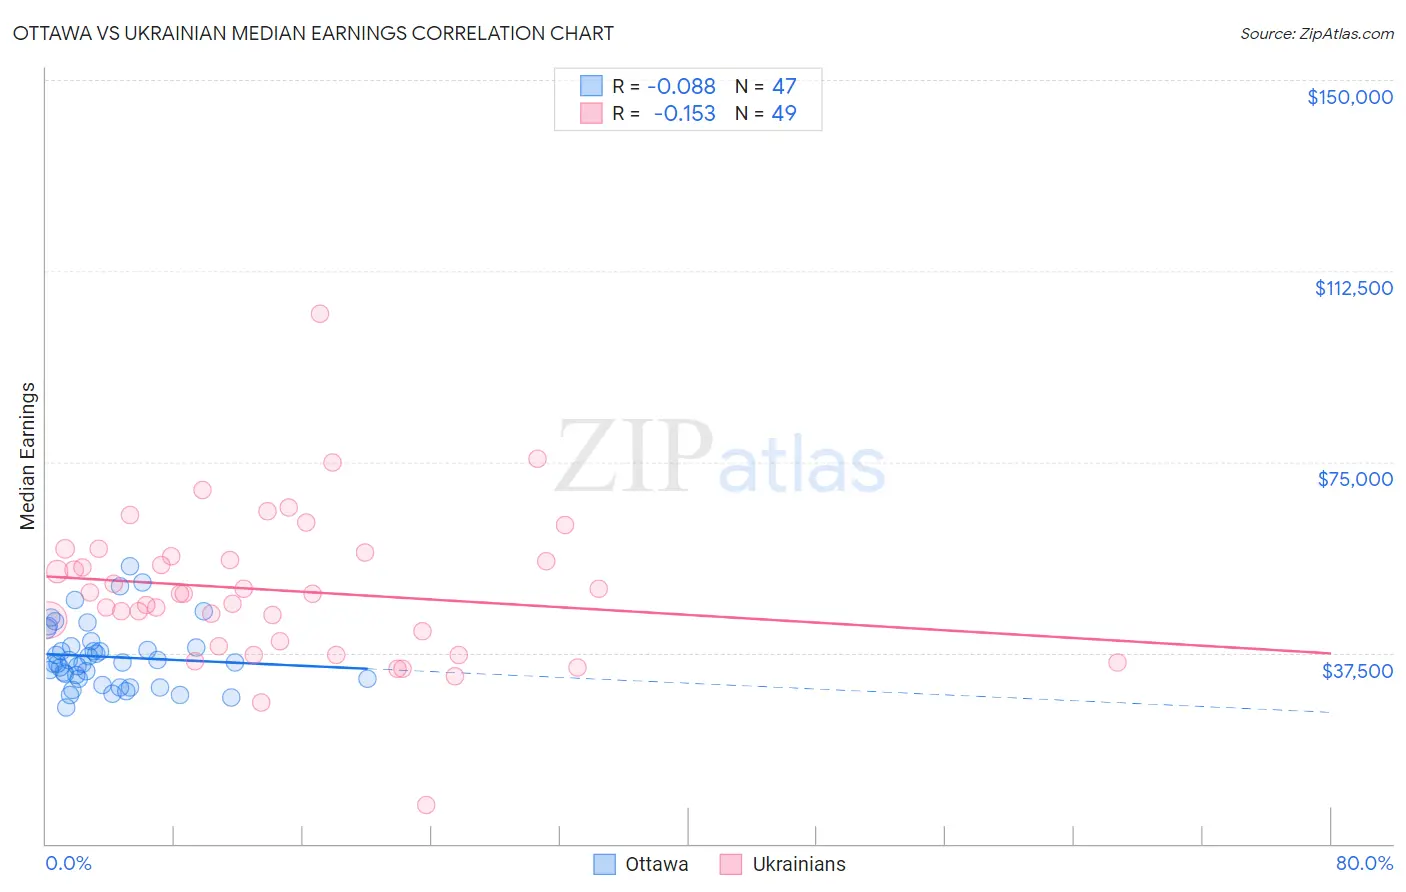
Ottawa vs Ukrainian Median Earnings Correlation Chart
The statistical analysis conducted on geographies consisting of 49,956,035 people shows a slight negative correlation between the proportion of Ottawa and median earnings in the United States with a correlation coefficient (R) of -0.088 and weighted average of $39,721. Similarly, the statistical analysis conducted on geographies consisting of 448,668,422 people shows a poor negative correlation between the proportion of Ukrainians and median earnings in the United States with a correlation coefficient (R) of -0.153 and weighted average of $50,320, a difference of 26.7%.
Median Earnings Correlation Summary
| Measurement | Ottawa | Ukrainian |
| Minimum | $26,644 | $7,500 |
| Maximum | $54,444 | $104,015 |
| Range | $27,800 | $96,515 |
| Mean | $36,701 | $49,735 |
| Median | $35,608 | $49,200 |
| Interquartile 25% (IQ1) | $32,292 | $39,295 |
| Interquartile 75% (IQ3) | $38,794 | $56,811 |
| Interquartile Range (IQR) | $6,502 | $17,516 |
| Standard Deviation (Sample) | $6,309 | $14,902 |
| Standard Deviation (Population) | $6,241 | $14,749 |
Similar Demographics by Median Earnings
Demographics Similar to Ottawa by Median Earnings
In terms of median earnings, the demographic groups most similar to Ottawa are Bahamian ($39,735, a difference of 0.040%), Immigrants from Central America ($39,762, a difference of 0.10%), Creek ($39,648, a difference of 0.18%), Mexican ($39,834, a difference of 0.29%), and Immigrants from Bahamas ($39,861, a difference of 0.35%).
| Demographics | Rating | Rank | Median Earnings |
| Fijians | 0.0 /100 | #317 | Tragic $40,193 |
| Dutch West Indians | 0.0 /100 | #318 | Tragic $40,107 |
| Blacks/African Americans | 0.0 /100 | #319 | Tragic $40,085 |
| Immigrants | Bahamas | 0.0 /100 | #320 | Tragic $39,861 |
| Mexicans | 0.0 /100 | #321 | Tragic $39,834 |
| Immigrants | Central America | 0.0 /100 | #322 | Tragic $39,762 |
| Bahamians | 0.0 /100 | #323 | Tragic $39,735 |
| Ottawa | 0.0 /100 | #324 | Tragic $39,721 |
| Creek | 0.0 /100 | #325 | Tragic $39,648 |
| Immigrants | Yemen | 0.0 /100 | #326 | Tragic $39,540 |
| Yuman | 0.0 /100 | #327 | Tragic $39,523 |
| Sioux | 0.0 /100 | #328 | Tragic $39,448 |
| Kiowa | 0.0 /100 | #329 | Tragic $39,232 |
| Immigrants | Congo | 0.0 /100 | #330 | Tragic $39,169 |
| Immigrants | Mexico | 0.0 /100 | #331 | Tragic $39,114 |
Demographics Similar to Ukrainians by Median Earnings
In terms of median earnings, the demographic groups most similar to Ukrainians are Laotian ($50,343, a difference of 0.050%), Immigrants from Southern Europe ($50,280, a difference of 0.080%), Immigrants from Moldova ($50,274, a difference of 0.090%), Romanian ($50,244, a difference of 0.15%), and Argentinean ($50,399, a difference of 0.16%).
| Demographics | Rating | Rank | Median Earnings |
| Immigrants | Netherlands | 99.8 /100 | #73 | Exceptional $50,818 |
| South Africans | 99.8 /100 | #74 | Exceptional $50,752 |
| Immigrants | Scotland | 99.8 /100 | #75 | Exceptional $50,741 |
| Immigrants | Italy | 99.7 /100 | #76 | Exceptional $50,581 |
| Immigrants | Western Europe | 99.7 /100 | #77 | Exceptional $50,549 |
| Argentineans | 99.6 /100 | #78 | Exceptional $50,399 |
| Laotians | 99.6 /100 | #79 | Exceptional $50,343 |
| Ukrainians | 99.6 /100 | #80 | Exceptional $50,320 |
| Immigrants | Southern Europe | 99.6 /100 | #81 | Exceptional $50,280 |
| Immigrants | Moldova | 99.5 /100 | #82 | Exceptional $50,274 |
| Romanians | 99.5 /100 | #83 | Exceptional $50,244 |
| Immigrants | Hungary | 99.5 /100 | #84 | Exceptional $50,227 |
| Immigrants | Kazakhstan | 99.5 /100 | #85 | Exceptional $50,225 |
| Immigrants | Canada | 99.5 /100 | #86 | Exceptional $50,192 |
| Immigrants | Uzbekistan | 99.5 /100 | #87 | Exceptional $50,151 |