Ottawa vs Immigrants from Grenada Median Earnings
COMPARE
Ottawa
Immigrants from Grenada
Median Earnings
Median Earnings Comparison
Ottawa
Immigrants from Grenada
$39,721
MEDIAN EARNINGS
0.0/ 100
METRIC RATING
324th/ 347
METRIC RANK
$45,596
MEDIAN EARNINGS
23.6/ 100
METRIC RATING
210th/ 347
METRIC RANK
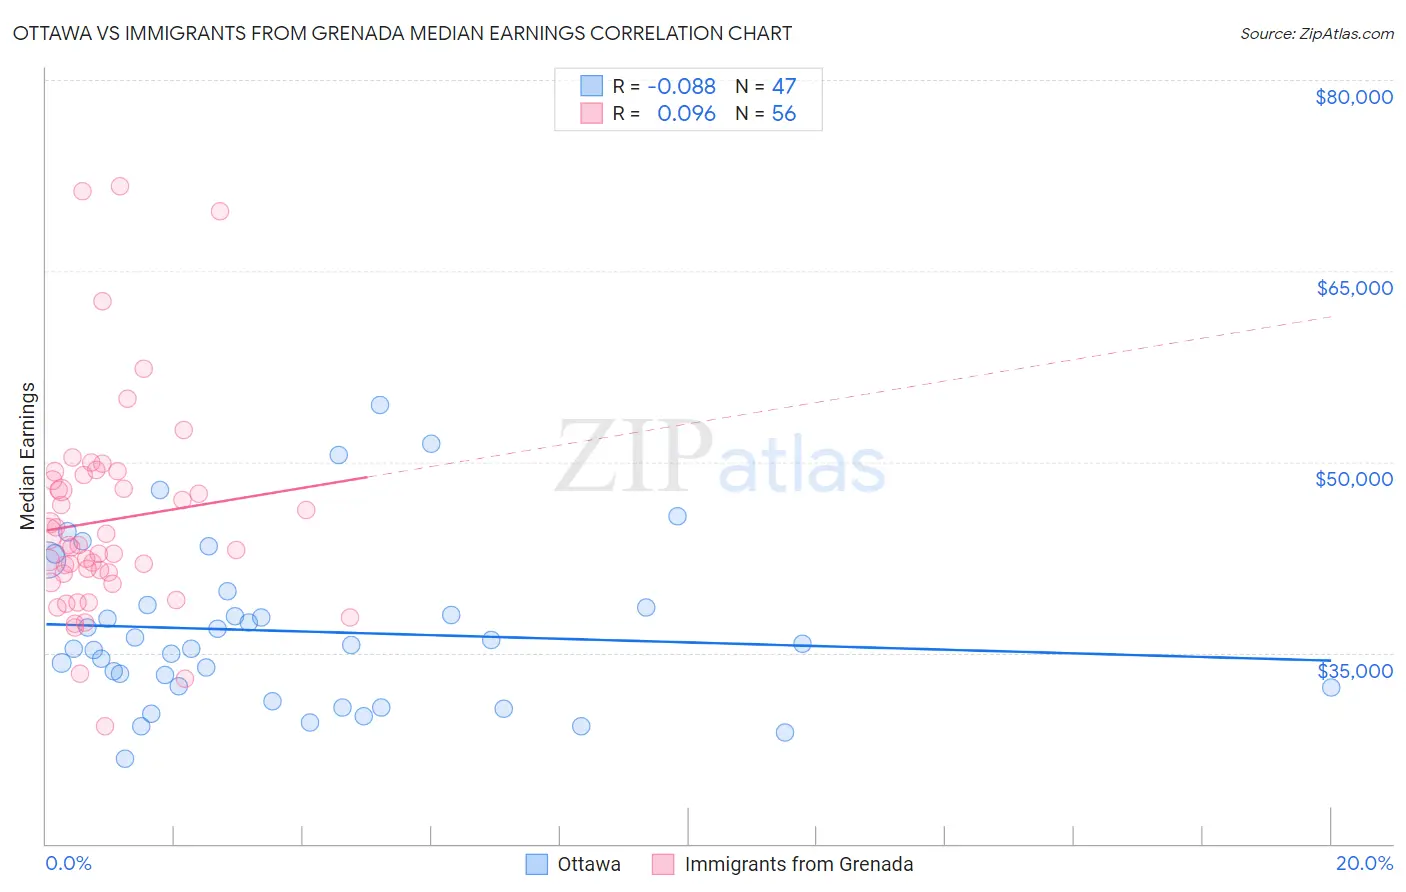
Ottawa vs Immigrants from Grenada Median Earnings Correlation Chart
The statistical analysis conducted on geographies consisting of 49,956,035 people shows a slight negative correlation between the proportion of Ottawa and median earnings in the United States with a correlation coefficient (R) of -0.088 and weighted average of $39,721. Similarly, the statistical analysis conducted on geographies consisting of 67,199,447 people shows a slight positive correlation between the proportion of Immigrants from Grenada and median earnings in the United States with a correlation coefficient (R) of 0.096 and weighted average of $45,596, a difference of 14.8%.
Median Earnings Correlation Summary
| Measurement | Ottawa | Immigrants from Grenada |
| Minimum | $26,644 | $29,237 |
| Maximum | $54,444 | $71,671 |
| Range | $27,800 | $42,434 |
| Mean | $36,701 | $45,405 |
| Median | $35,608 | $43,368 |
| Interquartile 25% (IQ1) | $32,292 | $40,879 |
| Interquartile 75% (IQ3) | $38,794 | $48,789 |
| Interquartile Range (IQR) | $6,502 | $7,911 |
| Standard Deviation (Sample) | $6,309 | $8,458 |
| Standard Deviation (Population) | $6,241 | $8,382 |
Similar Demographics by Median Earnings
Demographics Similar to Ottawa by Median Earnings
In terms of median earnings, the demographic groups most similar to Ottawa are Bahamian ($39,735, a difference of 0.040%), Immigrants from Central America ($39,762, a difference of 0.10%), Creek ($39,648, a difference of 0.18%), Mexican ($39,834, a difference of 0.29%), and Immigrants from Bahamas ($39,861, a difference of 0.35%).
| Demographics | Rating | Rank | Median Earnings |
| Fijians | 0.0 /100 | #317 | Tragic $40,193 |
| Dutch West Indians | 0.0 /100 | #318 | Tragic $40,107 |
| Blacks/African Americans | 0.0 /100 | #319 | Tragic $40,085 |
| Immigrants | Bahamas | 0.0 /100 | #320 | Tragic $39,861 |
| Mexicans | 0.0 /100 | #321 | Tragic $39,834 |
| Immigrants | Central America | 0.0 /100 | #322 | Tragic $39,762 |
| Bahamians | 0.0 /100 | #323 | Tragic $39,735 |
| Ottawa | 0.0 /100 | #324 | Tragic $39,721 |
| Creek | 0.0 /100 | #325 | Tragic $39,648 |
| Immigrants | Yemen | 0.0 /100 | #326 | Tragic $39,540 |
| Yuman | 0.0 /100 | #327 | Tragic $39,523 |
| Sioux | 0.0 /100 | #328 | Tragic $39,448 |
| Kiowa | 0.0 /100 | #329 | Tragic $39,232 |
| Immigrants | Congo | 0.0 /100 | #330 | Tragic $39,169 |
| Immigrants | Mexico | 0.0 /100 | #331 | Tragic $39,114 |
Demographics Similar to Immigrants from Grenada by Median Earnings
In terms of median earnings, the demographic groups most similar to Immigrants from Grenada are Immigrants from Thailand ($45,598, a difference of 0.0%), Immigrants from Bosnia and Herzegovina ($45,600, a difference of 0.010%), Panamanian ($45,593, a difference of 0.010%), Bermudan ($45,593, a difference of 0.010%), and Immigrants from Senegal ($45,611, a difference of 0.030%).
| Demographics | Rating | Rank | Median Earnings |
| Welsh | 26.6 /100 | #203 | Fair $45,710 |
| Immigrants | Uruguay | 25.9 /100 | #204 | Fair $45,682 |
| Tongans | 25.4 /100 | #205 | Fair $45,665 |
| Immigrants | Ghana | 24.8 /100 | #206 | Fair $45,641 |
| Immigrants | Senegal | 24.0 /100 | #207 | Fair $45,611 |
| Immigrants | Bosnia and Herzegovina | 23.7 /100 | #208 | Fair $45,600 |
| Immigrants | Thailand | 23.7 /100 | #209 | Fair $45,598 |
| Immigrants | Grenada | 23.6 /100 | #210 | Fair $45,596 |
| Panamanians | 23.5 /100 | #211 | Fair $45,593 |
| Bermudans | 23.5 /100 | #212 | Fair $45,593 |
| Immigrants | Colombia | 22.4 /100 | #213 | Fair $45,550 |
| Nigerians | 22.0 /100 | #214 | Fair $45,532 |
| Immigrants | Bangladesh | 22.0 /100 | #215 | Fair $45,532 |
| Guyanese | 20.6 /100 | #216 | Fair $45,470 |
| Tlingit-Haida | 20.5 /100 | #217 | Fair $45,468 |