Croatian vs Immigrants Median Female Earnings
COMPARE
Croatian
Immigrants
Median Female Earnings
Median Female Earnings Comparison
Croatians
Immigrants
$40,993
MEDIAN FEMALE EARNINGS
93.7/ 100
METRIC RATING
121st/ 347
METRIC RANK
$39,328
MEDIAN FEMALE EARNINGS
31.7/ 100
METRIC RATING
192nd/ 347
METRIC RANK
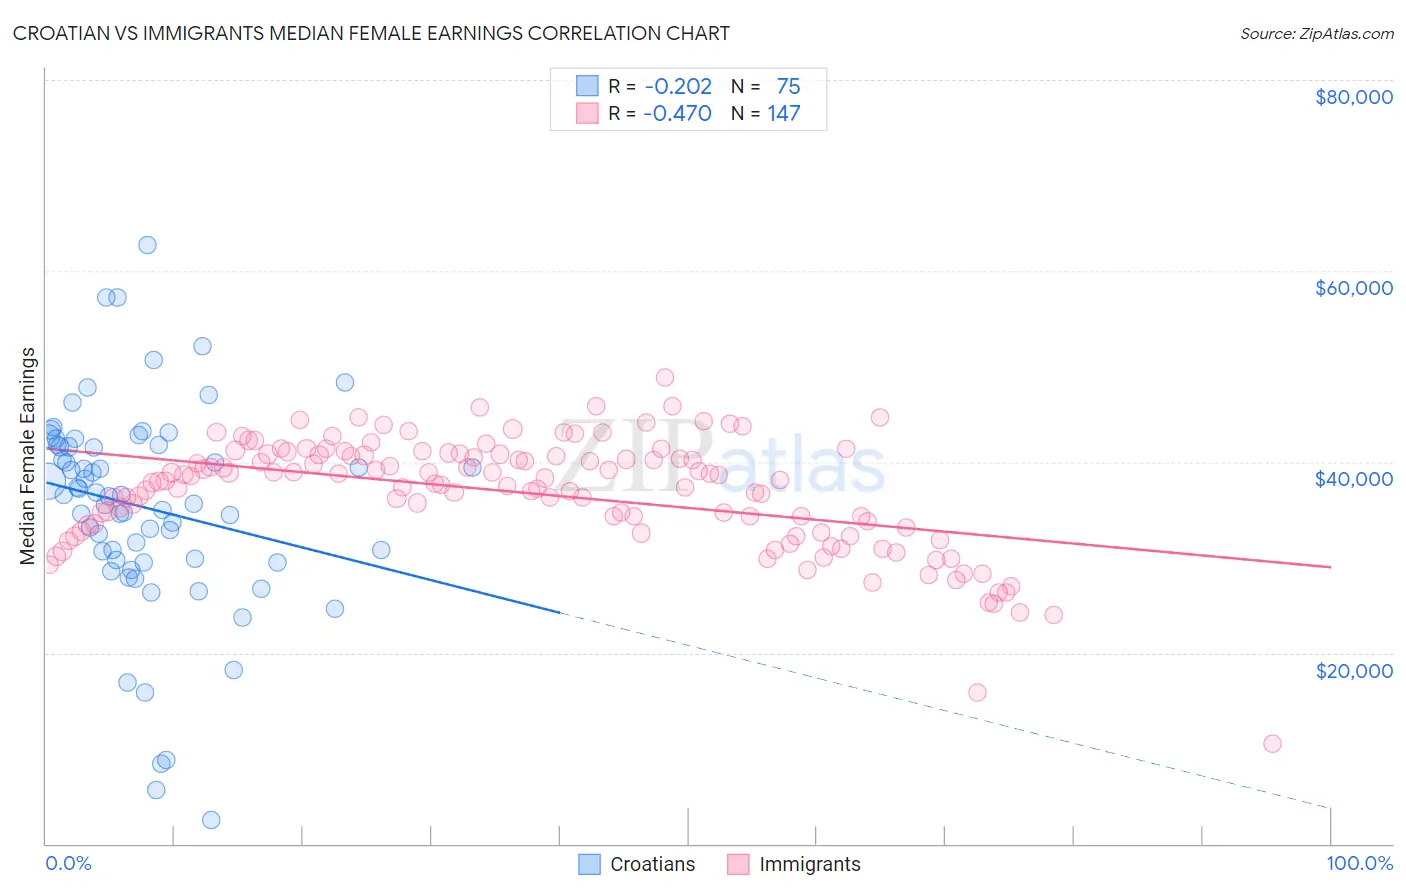
Croatian vs Immigrants Median Female Earnings Correlation Chart
The statistical analysis conducted on geographies consisting of 375,526,818 people shows a weak negative correlation between the proportion of Croatians and median female earnings in the United States with a correlation coefficient (R) of -0.202 and weighted average of $40,993. Similarly, the statistical analysis conducted on geographies consisting of 575,241,597 people shows a moderate negative correlation between the proportion of Immigrants and median female earnings in the United States with a correlation coefficient (R) of -0.470 and weighted average of $39,328, a difference of 4.2%.
Median Female Earnings Correlation Summary
| Measurement | Croatian | Immigrants |
| Minimum | $2,499 | $10,532 |
| Maximum | $62,750 | $48,847 |
| Range | $60,251 | $38,315 |
| Mean | $35,223 | $36,737 |
| Median | $36,468 | $38,007 |
| Interquartile 25% (IQ1) | $29,748 | $33,067 |
| Interquartile 75% (IQ3) | $41,743 | $40,787 |
| Interquartile Range (IQR) | $11,995 | $7,720 |
| Standard Deviation (Sample) | $11,020 | $5,900 |
| Standard Deviation (Population) | $10,947 | $5,880 |
Similar Demographics by Median Female Earnings
Demographics Similar to Croatians by Median Female Earnings
In terms of median female earnings, the demographic groups most similar to Croatians are Immigrants from Jordan ($40,977, a difference of 0.040%), Guyanese ($40,973, a difference of 0.050%), Trinidadian and Tobagonian ($40,958, a difference of 0.090%), Immigrants from Kuwait ($41,055, a difference of 0.15%), and Austrian ($40,923, a difference of 0.17%).
| Demographics | Rating | Rank | Median Female Earnings |
| Immigrants | England | 96.4 /100 | #114 | Exceptional $41,277 |
| Koreans | 96.4 /100 | #115 | Exceptional $41,276 |
| Immigrants | Brazil | 96.4 /100 | #116 | Exceptional $41,273 |
| Barbadians | 96.3 /100 | #117 | Exceptional $41,261 |
| Immigrants | Lebanon | 95.6 /100 | #118 | Exceptional $41,183 |
| Immigrants | Philippines | 95.0 /100 | #119 | Exceptional $41,114 |
| Immigrants | Kuwait | 94.4 /100 | #120 | Exceptional $41,055 |
| Croatians | 93.7 /100 | #121 | Exceptional $40,993 |
| Immigrants | Jordan | 93.5 /100 | #122 | Exceptional $40,977 |
| Guyanese | 93.4 /100 | #123 | Exceptional $40,973 |
| Trinidadians and Tobagonians | 93.2 /100 | #124 | Exceptional $40,958 |
| Austrians | 92.7 /100 | #125 | Exceptional $40,923 |
| Immigrants | Trinidad and Tobago | 92.3 /100 | #126 | Exceptional $40,895 |
| Ugandans | 92.2 /100 | #127 | Exceptional $40,889 |
| Carpatho Rusyns | 91.2 /100 | #128 | Exceptional $40,825 |
Demographics Similar to Immigrants by Median Female Earnings
In terms of median female earnings, the demographic groups most similar to Immigrants are Immigrants from Western Africa ($39,351, a difference of 0.060%), Immigrants from Nigeria ($39,294, a difference of 0.090%), Irish ($39,291, a difference of 0.090%), Puget Sound Salish ($39,376, a difference of 0.12%), and Senegalese ($39,384, a difference of 0.14%).
| Demographics | Rating | Rank | Median Female Earnings |
| Immigrants | West Indies | 36.9 /100 | #185 | Fair $39,441 |
| Colombians | 36.9 /100 | #186 | Fair $39,439 |
| Swedes | 36.0 /100 | #187 | Fair $39,421 |
| Bermudans | 35.9 /100 | #188 | Fair $39,418 |
| Senegalese | 34.2 /100 | #189 | Fair $39,384 |
| Puget Sound Salish | 33.9 /100 | #190 | Fair $39,376 |
| Immigrants | Western Africa | 32.7 /100 | #191 | Fair $39,351 |
| Immigrants | Immigrants | 31.7 /100 | #192 | Fair $39,328 |
| Immigrants | Nigeria | 30.2 /100 | #193 | Fair $39,294 |
| Irish | 30.0 /100 | #194 | Fair $39,291 |
| Uruguayans | 27.3 /100 | #195 | Fair $39,228 |
| Immigrants | Costa Rica | 25.6 /100 | #196 | Fair $39,186 |
| Assyrians/Chaldeans/Syriacs | 24.6 /100 | #197 | Fair $39,159 |
| Ecuadorians | 23.0 /100 | #198 | Fair $39,117 |
| Icelanders | 22.7 /100 | #199 | Fair $39,109 |