Immigrants from Spain vs Immigrants Median Female Earnings
COMPARE
Immigrants from Spain
Immigrants
Median Female Earnings
Median Female Earnings Comparison
Immigrants from Spain
Immigrants
$42,815
MEDIAN FEMALE EARNINGS
99.8/ 100
METRIC RATING
69th/ 347
METRIC RANK
$39,328
MEDIAN FEMALE EARNINGS
31.7/ 100
METRIC RATING
192nd/ 347
METRIC RANK
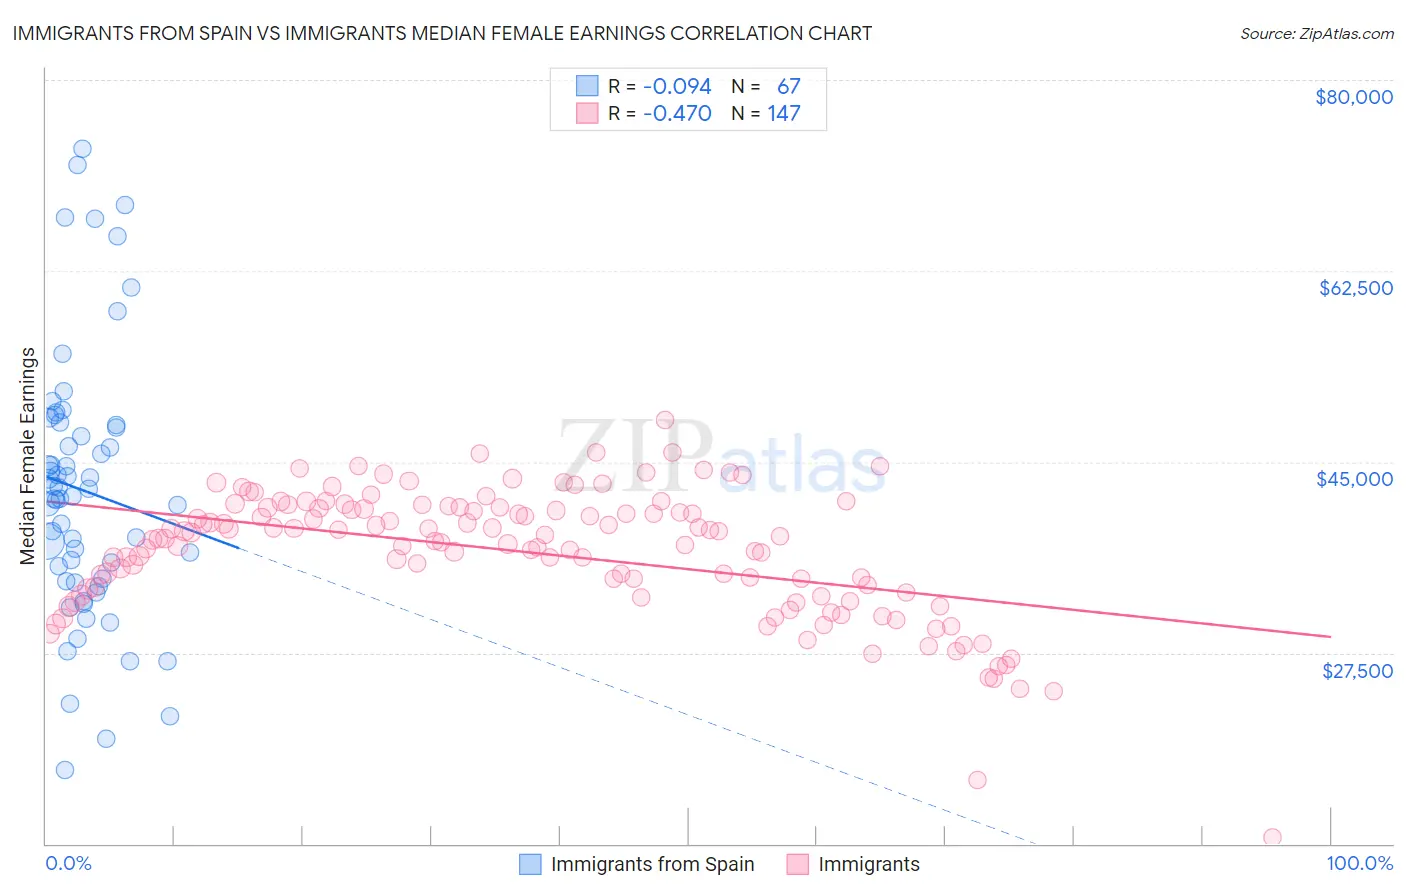
Immigrants from Spain vs Immigrants Median Female Earnings Correlation Chart
The statistical analysis conducted on geographies consisting of 239,646,958 people shows a slight negative correlation between the proportion of Immigrants from Spain and median female earnings in the United States with a correlation coefficient (R) of -0.094 and weighted average of $42,815. Similarly, the statistical analysis conducted on geographies consisting of 575,241,597 people shows a moderate negative correlation between the proportion of Immigrants and median female earnings in the United States with a correlation coefficient (R) of -0.470 and weighted average of $39,328, a difference of 8.9%.
Median Female Earnings Correlation Summary
| Measurement | Immigrants from Spain | Immigrants |
| Minimum | $16,765 | $10,532 |
| Maximum | $73,707 | $48,847 |
| Range | $56,942 | $38,315 |
| Mean | $42,367 | $36,737 |
| Median | $41,842 | $38,007 |
| Interquartile 25% (IQ1) | $34,065 | $33,067 |
| Interquartile 75% (IQ3) | $48,345 | $40,787 |
| Interquartile Range (IQR) | $14,280 | $7,720 |
| Standard Deviation (Sample) | $12,186 | $5,900 |
| Standard Deviation (Population) | $12,095 | $5,880 |
Similar Demographics by Median Female Earnings
Demographics Similar to Immigrants from Spain by Median Female Earnings
In terms of median female earnings, the demographic groups most similar to Immigrants from Spain are Immigrants from Austria ($42,824, a difference of 0.020%), Immigrants from Norway ($42,837, a difference of 0.050%), Immigrants from Egypt ($42,837, a difference of 0.050%), Sierra Leonean ($42,868, a difference of 0.12%), and Immigrants from Ethiopia ($42,744, a difference of 0.17%).
| Demographics | Rating | Rank | Median Female Earnings |
| Afghans | 99.9 /100 | #62 | Exceptional $43,077 |
| Immigrants | Ukraine | 99.9 /100 | #63 | Exceptional $43,069 |
| Immigrants | Pakistan | 99.9 /100 | #64 | Exceptional $43,052 |
| Sierra Leoneans | 99.9 /100 | #65 | Exceptional $42,868 |
| Immigrants | Norway | 99.9 /100 | #66 | Exceptional $42,837 |
| Immigrants | Egypt | 99.9 /100 | #67 | Exceptional $42,837 |
| Immigrants | Austria | 99.8 /100 | #68 | Exceptional $42,824 |
| Immigrants | Spain | 99.8 /100 | #69 | Exceptional $42,815 |
| Immigrants | Ethiopia | 99.8 /100 | #70 | Exceptional $42,744 |
| Immigrants | Romania | 99.8 /100 | #71 | Exceptional $42,718 |
| Albanians | 99.8 /100 | #72 | Exceptional $42,584 |
| Mongolians | 99.7 /100 | #73 | Exceptional $42,542 |
| Immigrants | South Africa | 99.7 /100 | #74 | Exceptional $42,508 |
| New Zealanders | 99.7 /100 | #75 | Exceptional $42,446 |
| Immigrants | Italy | 99.7 /100 | #76 | Exceptional $42,446 |
Demographics Similar to Immigrants by Median Female Earnings
In terms of median female earnings, the demographic groups most similar to Immigrants are Immigrants from Western Africa ($39,351, a difference of 0.060%), Immigrants from Nigeria ($39,294, a difference of 0.090%), Irish ($39,291, a difference of 0.090%), Puget Sound Salish ($39,376, a difference of 0.12%), and Senegalese ($39,384, a difference of 0.14%).
| Demographics | Rating | Rank | Median Female Earnings |
| Immigrants | West Indies | 36.9 /100 | #185 | Fair $39,441 |
| Colombians | 36.9 /100 | #186 | Fair $39,439 |
| Swedes | 36.0 /100 | #187 | Fair $39,421 |
| Bermudans | 35.9 /100 | #188 | Fair $39,418 |
| Senegalese | 34.2 /100 | #189 | Fair $39,384 |
| Puget Sound Salish | 33.9 /100 | #190 | Fair $39,376 |
| Immigrants | Western Africa | 32.7 /100 | #191 | Fair $39,351 |
| Immigrants | Immigrants | 31.7 /100 | #192 | Fair $39,328 |
| Immigrants | Nigeria | 30.2 /100 | #193 | Fair $39,294 |
| Irish | 30.0 /100 | #194 | Fair $39,291 |
| Uruguayans | 27.3 /100 | #195 | Fair $39,228 |
| Immigrants | Costa Rica | 25.6 /100 | #196 | Fair $39,186 |
| Assyrians/Chaldeans/Syriacs | 24.6 /100 | #197 | Fair $39,159 |
| Ecuadorians | 23.0 /100 | #198 | Fair $39,117 |
| Icelanders | 22.7 /100 | #199 | Fair $39,109 |