South American vs Immigrants Median Female Earnings
COMPARE
South American
Immigrants
Median Female Earnings
Median Female Earnings Comparison
South Americans
Immigrants
$39,698
MEDIAN FEMALE EARNINGS
50.0/ 100
METRIC RATING
174th/ 347
METRIC RANK
$39,328
MEDIAN FEMALE EARNINGS
31.7/ 100
METRIC RATING
192nd/ 347
METRIC RANK
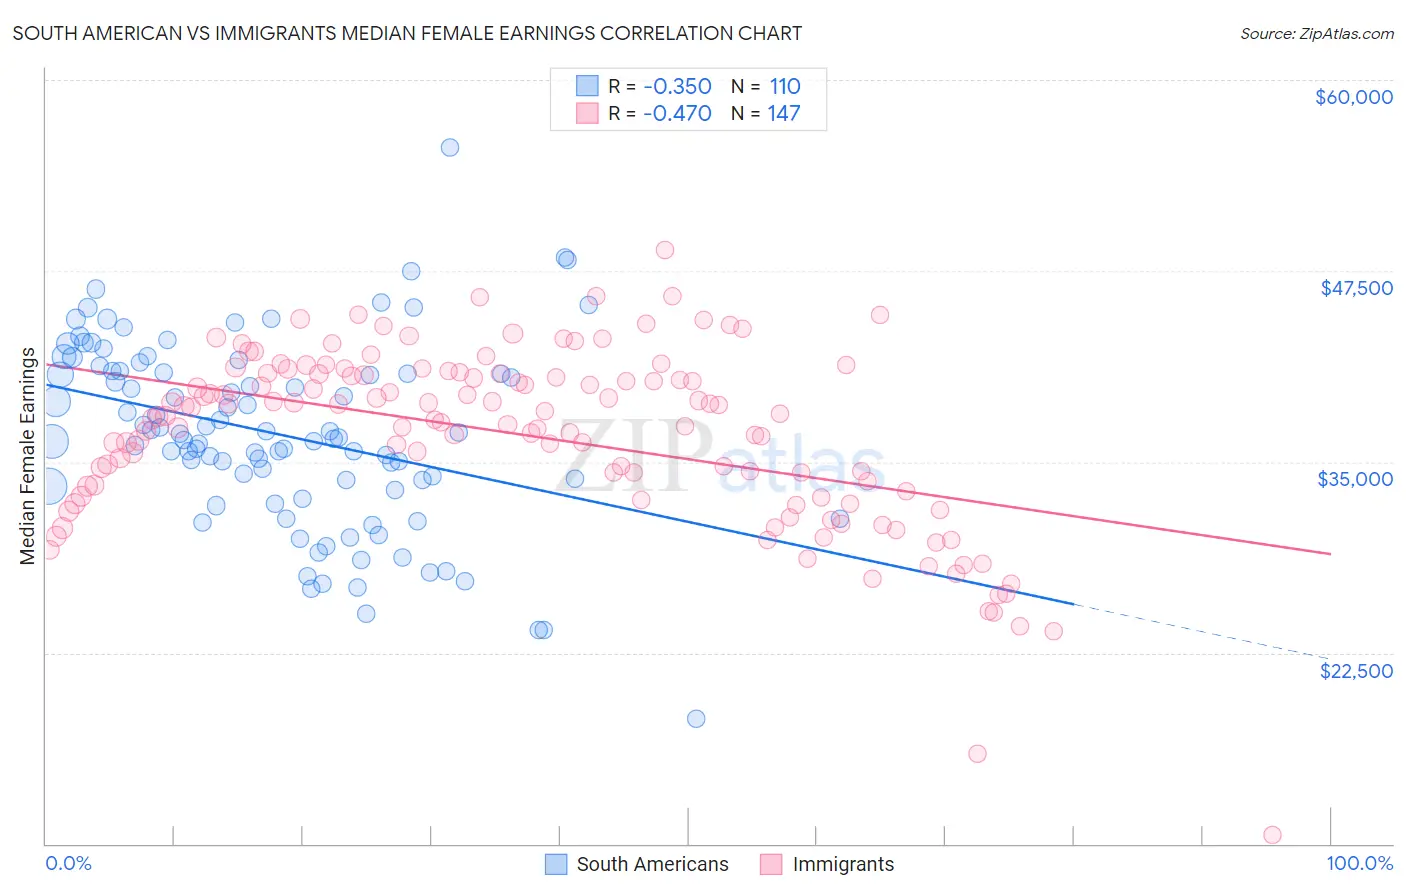
South American vs Immigrants Median Female Earnings Correlation Chart
The statistical analysis conducted on geographies consisting of 493,793,554 people shows a mild negative correlation between the proportion of South Americans and median female earnings in the United States with a correlation coefficient (R) of -0.350 and weighted average of $39,698. Similarly, the statistical analysis conducted on geographies consisting of 575,241,597 people shows a moderate negative correlation between the proportion of Immigrants and median female earnings in the United States with a correlation coefficient (R) of -0.470 and weighted average of $39,328, a difference of 0.94%.
Median Female Earnings Correlation Summary
| Measurement | South American | Immigrants |
| Minimum | $18,150 | $10,532 |
| Maximum | $55,607 | $48,847 |
| Range | $37,457 | $38,315 |
| Mean | $36,804 | $36,737 |
| Median | $36,715 | $38,007 |
| Interquartile 25% (IQ1) | $33,376 | $33,067 |
| Interquartile 75% (IQ3) | $40,920 | $40,787 |
| Interquartile Range (IQR) | $7,545 | $7,720 |
| Standard Deviation (Sample) | $6,134 | $5,900 |
| Standard Deviation (Population) | $6,106 | $5,880 |
Demographics Similar to South Americans and Immigrants by Median Female Earnings
In terms of median female earnings, the demographic groups most similar to South Americans are Canadian ($39,724, a difference of 0.070%), Immigrants from South America ($39,643, a difference of 0.14%), Nigerian ($39,641, a difference of 0.14%), Costa Rican ($39,622, a difference of 0.19%), and Slavic ($39,613, a difference of 0.21%). Similarly, the demographic groups most similar to Immigrants are Immigrants from Western Africa ($39,351, a difference of 0.060%), Immigrants from Nigeria ($39,294, a difference of 0.090%), Puget Sound Salish ($39,376, a difference of 0.12%), Senegalese ($39,384, a difference of 0.14%), and Bermudan ($39,418, a difference of 0.23%).
| Demographics | Rating | Rank | Median Female Earnings |
| Canadians | 51.4 /100 | #173 | Average $39,724 |
| South Americans | 50.0 /100 | #174 | Average $39,698 |
| Immigrants | South America | 47.2 /100 | #175 | Average $39,643 |
| Nigerians | 47.0 /100 | #176 | Average $39,641 |
| Costa Ricans | 46.1 /100 | #177 | Average $39,622 |
| Slavs | 45.6 /100 | #178 | Average $39,613 |
| Immigrants | Germany | 45.1 /100 | #179 | Average $39,603 |
| Immigrants | Kenya | 41.6 /100 | #180 | Average $39,535 |
| Tsimshian | 41.4 /100 | #181 | Average $39,530 |
| Tlingit-Haida | 40.5 /100 | #182 | Average $39,513 |
| Hungarians | 40.3 /100 | #183 | Average $39,510 |
| Europeans | 37.7 /100 | #184 | Fair $39,457 |
| Immigrants | West Indies | 36.9 /100 | #185 | Fair $39,441 |
| Colombians | 36.9 /100 | #186 | Fair $39,439 |
| Swedes | 36.0 /100 | #187 | Fair $39,421 |
| Bermudans | 35.9 /100 | #188 | Fair $39,418 |
| Senegalese | 34.2 /100 | #189 | Fair $39,384 |
| Puget Sound Salish | 33.9 /100 | #190 | Fair $39,376 |
| Immigrants | Western Africa | 32.7 /100 | #191 | Fair $39,351 |
| Immigrants | Immigrants | 31.7 /100 | #192 | Fair $39,328 |
| Immigrants | Nigeria | 30.2 /100 | #193 | Fair $39,294 |