Nepalese vs Immigrants from Ghana In Labor Force | Age 35-44
COMPARE
Nepalese
Immigrants from Ghana
In Labor Force | Age 35-44
In Labor Force | Age 35-44 Comparison
Nepalese
Immigrants from Ghana
82.4%
IN LABOR FORCE | AGE 35-44
0.0/ 100
METRIC RATING
303rd/ 347
METRIC RANK
84.7%
IN LABOR FORCE | AGE 35-44
90.4/ 100
METRIC RATING
128th/ 347
METRIC RANK
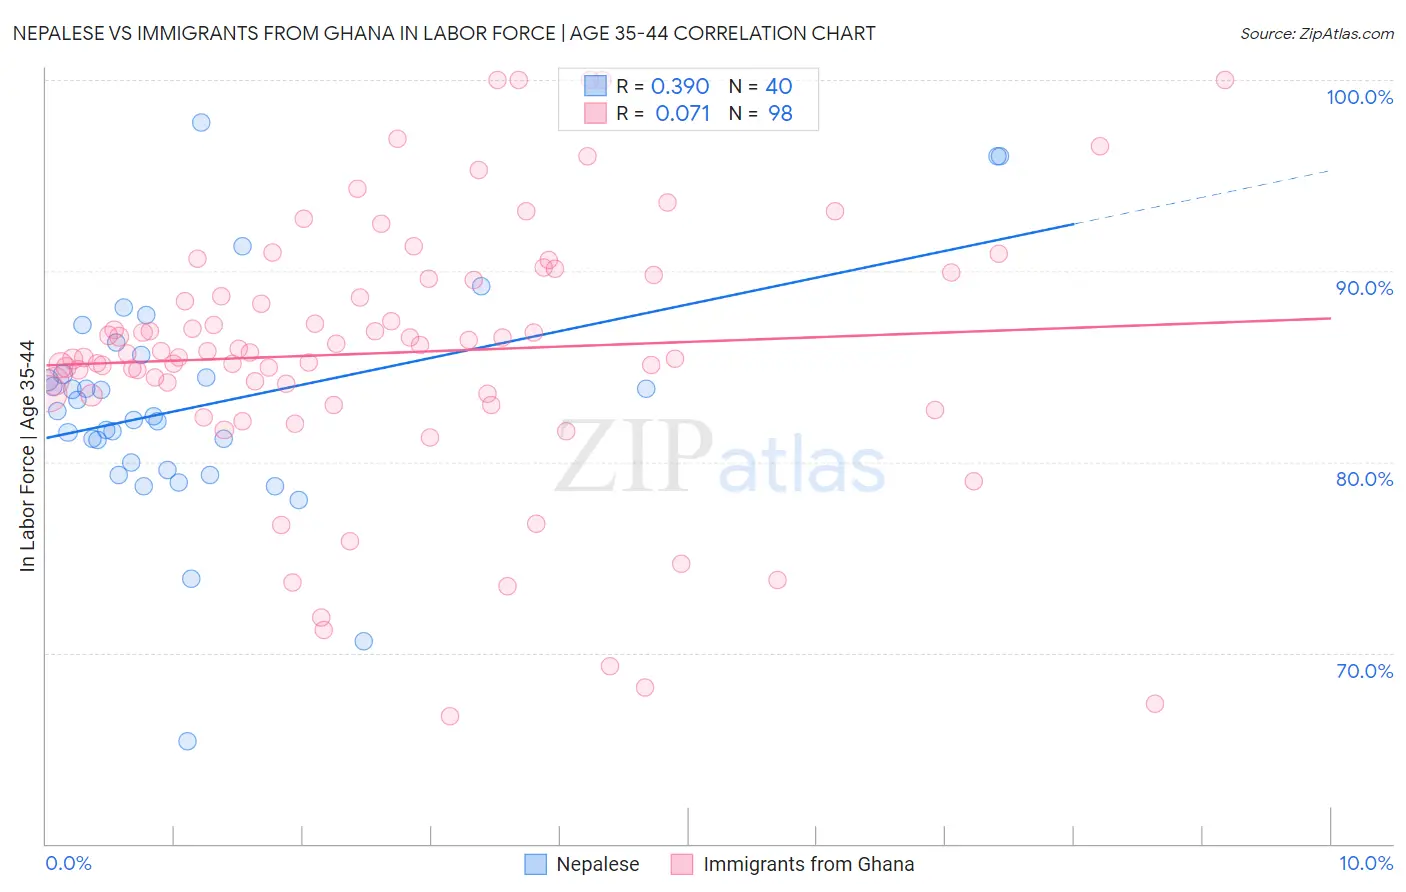
Nepalese vs Immigrants from Ghana In Labor Force | Age 35-44 Correlation Chart
The statistical analysis conducted on geographies consisting of 24,521,755 people shows a mild positive correlation between the proportion of Nepalese and labor force participation rate among population between the ages 35 and 44 in the United States with a correlation coefficient (R) of 0.390 and weighted average of 82.4%. Similarly, the statistical analysis conducted on geographies consisting of 199,842,455 people shows a slight positive correlation between the proportion of Immigrants from Ghana and labor force participation rate among population between the ages 35 and 44 in the United States with a correlation coefficient (R) of 0.071 and weighted average of 84.7%, a difference of 2.8%.
In Labor Force | Age 35-44 Correlation Summary
| Measurement | Nepalese | Immigrants from Ghana |
| Minimum | 65.4% | 66.7% |
| Maximum | 97.8% | 100.0% |
| Range | 32.4% | 33.3% |
| Mean | 83.0% | 85.7% |
| Median | 82.5% | 85.8% |
| Interquartile 25% (IQ1) | 79.8% | 83.6% |
| Interquartile 75% (IQ3) | 85.1% | 89.6% |
| Interquartile Range (IQR) | 5.3% | 6.0% |
| Standard Deviation (Sample) | 6.1% | 7.0% |
| Standard Deviation (Population) | 6.0% | 7.0% |
Similar Demographics by In Labor Force | Age 35-44
Demographics Similar to Nepalese by In Labor Force | Age 35-44
In terms of in labor force | age 35-44, the demographic groups most similar to Nepalese are American (82.4%, a difference of 0.0%), Marshallese (82.4%, a difference of 0.010%), Spanish American Indian (82.5%, a difference of 0.080%), Central American Indian (82.5%, a difference of 0.10%), and Tlingit-Haida (82.5%, a difference of 0.16%).
| Demographics | Rating | Rank | In Labor Force | Age 35-44 |
| Mexican American Indians | 0.0 /100 | #296 | Tragic 82.6% |
| Hmong | 0.0 /100 | #297 | Tragic 82.6% |
| Ottawa | 0.0 /100 | #298 | Tragic 82.6% |
| Tlingit-Haida | 0.0 /100 | #299 | Tragic 82.5% |
| Central American Indians | 0.0 /100 | #300 | Tragic 82.5% |
| Spanish American Indians | 0.0 /100 | #301 | Tragic 82.5% |
| Americans | 0.0 /100 | #302 | Tragic 82.4% |
| Nepalese | 0.0 /100 | #303 | Tragic 82.4% |
| Marshallese | 0.0 /100 | #304 | Tragic 82.4% |
| Shoshone | 0.0 /100 | #305 | Tragic 82.2% |
| Blacks/African Americans | 0.0 /100 | #306 | Tragic 82.2% |
| Hispanics or Latinos | 0.0 /100 | #307 | Tragic 82.1% |
| Immigrants | Central America | 0.0 /100 | #308 | Tragic 82.0% |
| Cree | 0.0 /100 | #309 | Tragic 82.0% |
| Blackfeet | 0.0 /100 | #310 | Tragic 81.9% |
Demographics Similar to Immigrants from Ghana by In Labor Force | Age 35-44
In terms of in labor force | age 35-44, the demographic groups most similar to Immigrants from Ghana are Asian (84.7%, a difference of 0.0%), Immigrants from Spain (84.7%, a difference of 0.0%), German (84.7%, a difference of 0.010%), Immigrants from South America (84.7%, a difference of 0.010%), and Slavic (84.7%, a difference of 0.010%).
| Demographics | Rating | Rank | In Labor Force | Age 35-44 |
| Finns | 91.2 /100 | #121 | Exceptional 84.7% |
| Germans | 91.0 /100 | #122 | Exceptional 84.7% |
| Immigrants | South America | 90.9 /100 | #123 | Exceptional 84.7% |
| Slavs | 90.8 /100 | #124 | Exceptional 84.7% |
| Maltese | 90.8 /100 | #125 | Exceptional 84.7% |
| Asians | 90.6 /100 | #126 | Exceptional 84.7% |
| Immigrants | Spain | 90.6 /100 | #127 | Exceptional 84.7% |
| Immigrants | Ghana | 90.4 /100 | #128 | Exceptional 84.7% |
| Palestinians | 89.7 /100 | #129 | Excellent 84.7% |
| Bhutanese | 89.7 /100 | #130 | Excellent 84.7% |
| Immigrants | Scotland | 89.6 /100 | #131 | Excellent 84.7% |
| Austrians | 89.4 /100 | #132 | Excellent 84.7% |
| Argentineans | 88.4 /100 | #133 | Excellent 84.6% |
| Immigrants | Korea | 88.2 /100 | #134 | Excellent 84.6% |
| Immigrants | Malaysia | 87.5 /100 | #135 | Excellent 84.6% |