American vs Immigrants from Ghana Median Female Earnings
COMPARE
American
Immigrants from Ghana
Median Female Earnings
Median Female Earnings Comparison
Americans
Immigrants from Ghana
$35,777
MEDIAN FEMALE EARNINGS
0.0/ 100
METRIC RATING
292nd/ 347
METRIC RANK
$39,894
MEDIAN FEMALE EARNINGS
60.0/ 100
METRIC RATING
166th/ 347
METRIC RANK
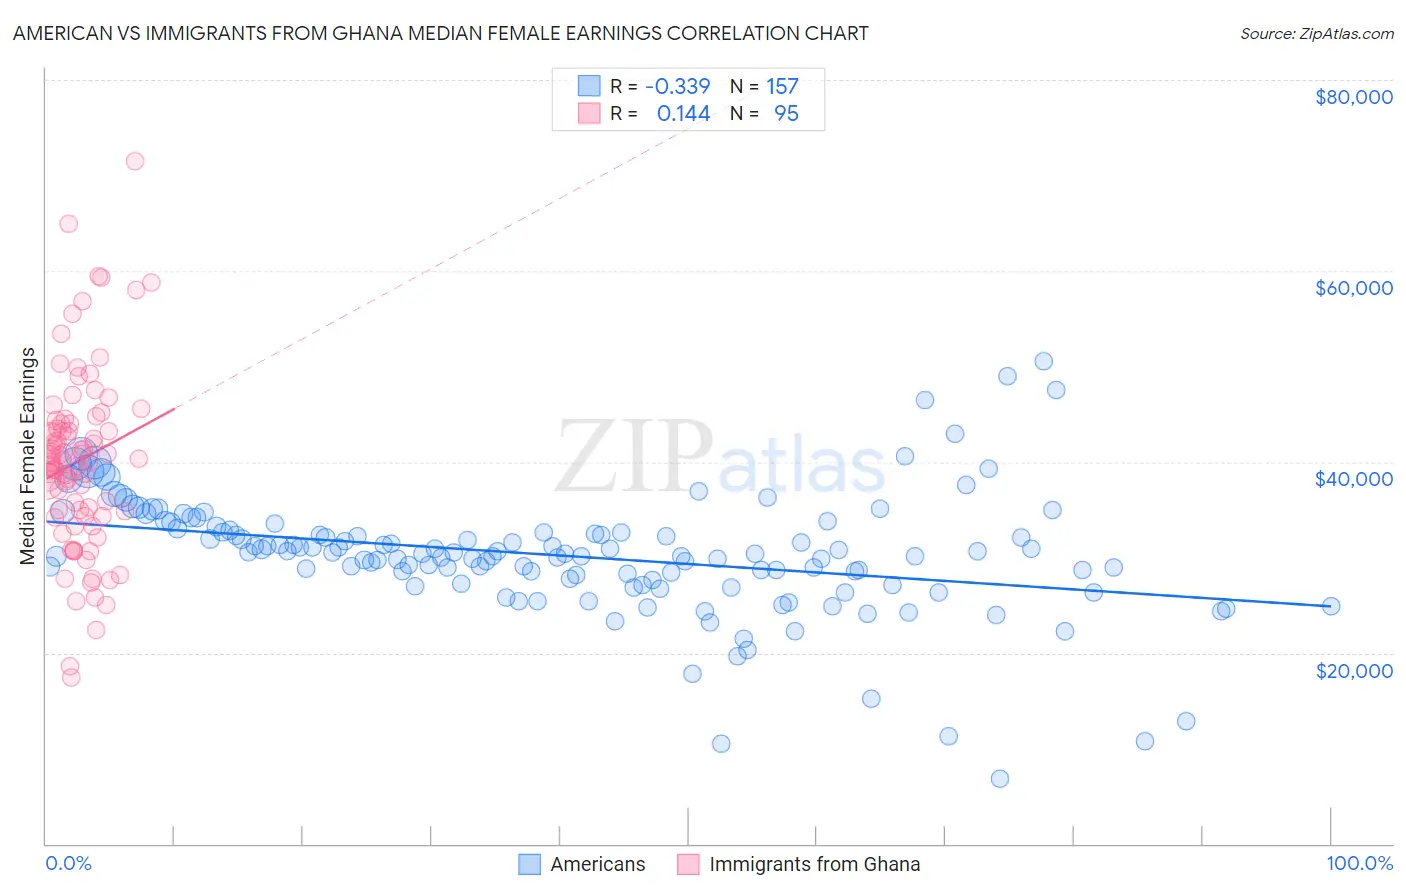
American vs Immigrants from Ghana Median Female Earnings Correlation Chart
The statistical analysis conducted on geographies consisting of 579,438,585 people shows a mild negative correlation between the proportion of Americans and median female earnings in the United States with a correlation coefficient (R) of -0.339 and weighted average of $35,777. Similarly, the statistical analysis conducted on geographies consisting of 199,948,896 people shows a poor positive correlation between the proportion of Immigrants from Ghana and median female earnings in the United States with a correlation coefficient (R) of 0.144 and weighted average of $39,894, a difference of 11.5%.
Median Female Earnings Correlation Summary
| Measurement | American | Immigrants from Ghana |
| Minimum | $6,772 | $17,379 |
| Maximum | $50,517 | $71,536 |
| Range | $43,745 | $54,157 |
| Mean | $30,170 | $40,108 |
| Median | $30,366 | $40,246 |
| Interquartile 25% (IQ1) | $27,419 | $34,346 |
| Interquartile 75% (IQ3) | $32,737 | $44,036 |
| Interquartile Range (IQR) | $5,318 | $9,690 |
| Standard Deviation (Sample) | $6,408 | $9,436 |
| Standard Deviation (Population) | $6,387 | $9,386 |
Similar Demographics by Median Female Earnings
Demographics Similar to Americans by Median Female Earnings
In terms of median female earnings, the demographic groups most similar to Americans are Guatemalan ($35,695, a difference of 0.23%), Blackfeet ($35,864, a difference of 0.24%), Cheyenne ($35,673, a difference of 0.29%), Comanche ($35,661, a difference of 0.32%), and Mexican American Indian ($35,629, a difference of 0.42%).
| Demographics | Rating | Rank | Median Female Earnings |
| Paiute | 0.1 /100 | #285 | Tragic $36,056 |
| Osage | 0.0 /100 | #286 | Tragic $36,034 |
| Immigrants | Nicaragua | 0.0 /100 | #287 | Tragic $36,023 |
| Immigrants | Zaire | 0.0 /100 | #288 | Tragic $36,017 |
| Bangladeshis | 0.0 /100 | #289 | Tragic $35,960 |
| Central American Indians | 0.0 /100 | #290 | Tragic $35,930 |
| Blackfeet | 0.0 /100 | #291 | Tragic $35,864 |
| Americans | 0.0 /100 | #292 | Tragic $35,777 |
| Guatemalans | 0.0 /100 | #293 | Tragic $35,695 |
| Cheyenne | 0.0 /100 | #294 | Tragic $35,673 |
| Comanche | 0.0 /100 | #295 | Tragic $35,661 |
| Mexican American Indians | 0.0 /100 | #296 | Tragic $35,629 |
| Hmong | 0.0 /100 | #297 | Tragic $35,498 |
| Immigrants | Micronesia | 0.0 /100 | #298 | Tragic $35,477 |
| Immigrants | Guatemala | 0.0 /100 | #299 | Tragic $35,444 |
Demographics Similar to Immigrants from Ghana by Median Female Earnings
In terms of median female earnings, the demographic groups most similar to Immigrants from Ghana are Luxembourger ($39,891, a difference of 0.010%), Immigrants from Bangladesh ($39,910, a difference of 0.040%), Immigrants from Peru ($39,871, a difference of 0.060%), Kenyan ($39,860, a difference of 0.080%), and Immigrants from Saudi Arabia ($39,952, a difference of 0.15%).
| Demographics | Rating | Rank | Median Female Earnings |
| Immigrants | Vietnam | 72.0 /100 | #159 | Good $40,153 |
| Inupiat | 68.9 /100 | #160 | Good $40,080 |
| Alsatians | 68.0 /100 | #161 | Good $40,060 |
| South American Indians | 66.1 /100 | #162 | Good $40,019 |
| Lebanese | 65.5 /100 | #163 | Good $40,006 |
| Immigrants | Saudi Arabia | 62.9 /100 | #164 | Good $39,952 |
| Immigrants | Bangladesh | 60.8 /100 | #165 | Good $39,910 |
| Immigrants | Ghana | 60.0 /100 | #166 | Good $39,894 |
| Luxembourgers | 59.9 /100 | #167 | Average $39,891 |
| Immigrants | Peru | 58.9 /100 | #168 | Average $39,871 |
| Kenyans | 58.4 /100 | #169 | Average $39,860 |
| Slovenes | 56.2 /100 | #170 | Average $39,817 |
| Immigrants | Portugal | 54.7 /100 | #171 | Average $39,788 |
| British | 53.8 /100 | #172 | Average $39,772 |
| Canadians | 51.4 /100 | #173 | Average $39,724 |