Colombian vs Immigrants from Ghana Median Female Earnings
COMPARE
Colombian
Immigrants from Ghana
Median Female Earnings
Median Female Earnings Comparison
Colombians
Immigrants from Ghana
$39,439
MEDIAN FEMALE EARNINGS
36.9/ 100
METRIC RATING
186th/ 347
METRIC RANK
$39,894
MEDIAN FEMALE EARNINGS
60.0/ 100
METRIC RATING
166th/ 347
METRIC RANK
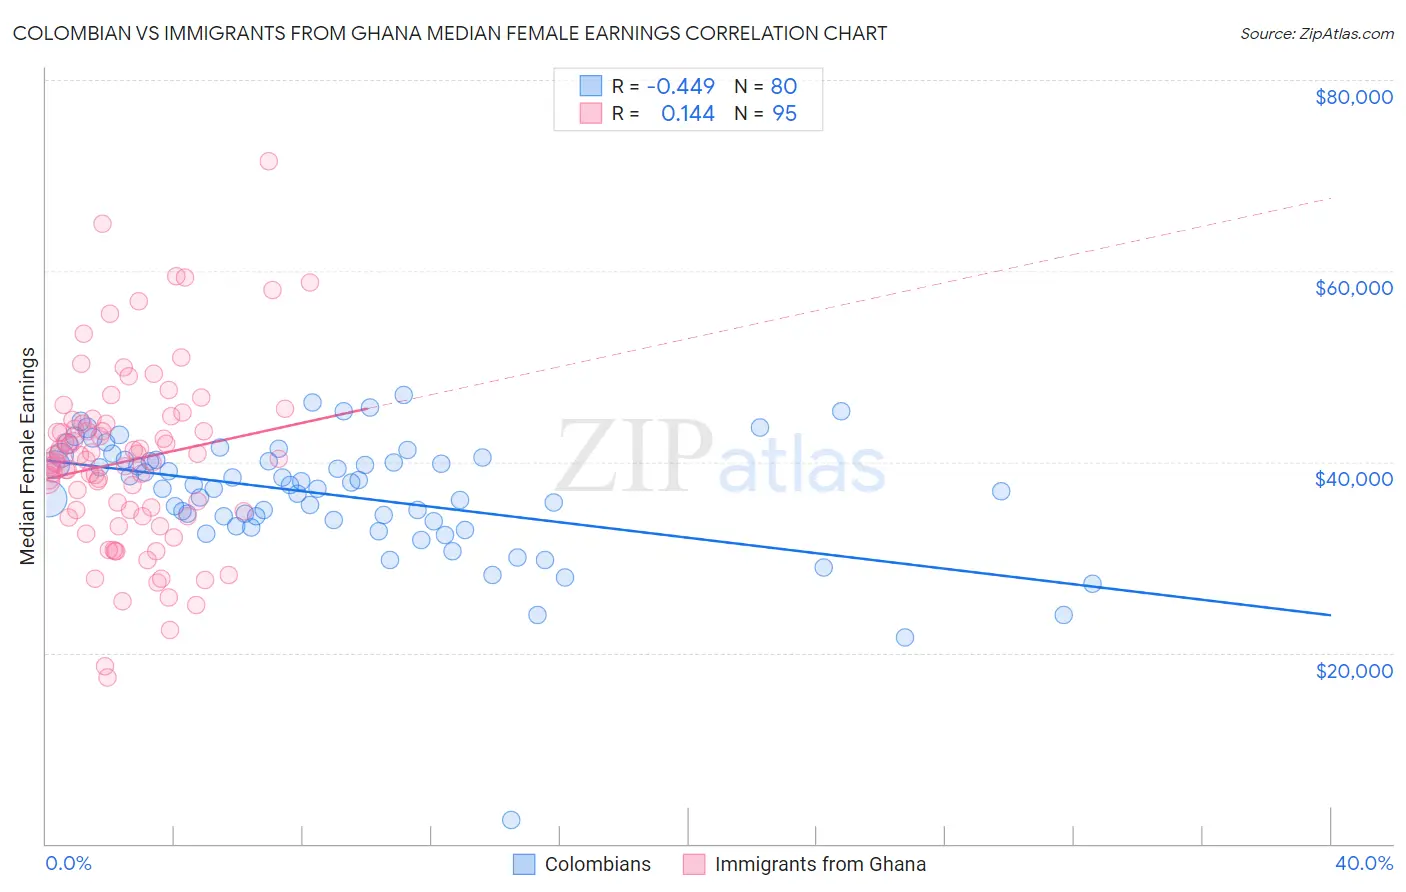
Colombian vs Immigrants from Ghana Median Female Earnings Correlation Chart
The statistical analysis conducted on geographies consisting of 419,536,375 people shows a moderate negative correlation between the proportion of Colombians and median female earnings in the United States with a correlation coefficient (R) of -0.449 and weighted average of $39,439. Similarly, the statistical analysis conducted on geographies consisting of 199,948,896 people shows a poor positive correlation between the proportion of Immigrants from Ghana and median female earnings in the United States with a correlation coefficient (R) of 0.144 and weighted average of $39,894, a difference of 1.1%.
Median Female Earnings Correlation Summary
| Measurement | Colombian | Immigrants from Ghana |
| Minimum | $2,499 | $17,379 |
| Maximum | $46,974 | $71,536 |
| Range | $44,475 | $54,157 |
| Mean | $36,461 | $40,108 |
| Median | $37,418 | $40,246 |
| Interquartile 25% (IQ1) | $33,852 | $34,346 |
| Interquartile 75% (IQ3) | $40,193 | $44,036 |
| Interquartile Range (IQR) | $6,341 | $9,690 |
| Standard Deviation (Sample) | $6,518 | $9,436 |
| Standard Deviation (Population) | $6,477 | $9,386 |
Demographics Similar to Colombians and Immigrants from Ghana by Median Female Earnings
In terms of median female earnings, the demographic groups most similar to Colombians are Immigrants from West Indies ($39,441, a difference of 0.0%), European ($39,457, a difference of 0.040%), Hungarian ($39,510, a difference of 0.18%), Tlingit-Haida ($39,513, a difference of 0.19%), and Tsimshian ($39,530, a difference of 0.23%). Similarly, the demographic groups most similar to Immigrants from Ghana are Luxembourger ($39,891, a difference of 0.010%), Immigrants from Peru ($39,871, a difference of 0.060%), Kenyan ($39,860, a difference of 0.080%), Slovene ($39,817, a difference of 0.19%), and Immigrants from Portugal ($39,788, a difference of 0.27%).
| Demographics | Rating | Rank | Median Female Earnings |
| Immigrants | Ghana | 60.0 /100 | #166 | Good $39,894 |
| Luxembourgers | 59.9 /100 | #167 | Average $39,891 |
| Immigrants | Peru | 58.9 /100 | #168 | Average $39,871 |
| Kenyans | 58.4 /100 | #169 | Average $39,860 |
| Slovenes | 56.2 /100 | #170 | Average $39,817 |
| Immigrants | Portugal | 54.7 /100 | #171 | Average $39,788 |
| British | 53.8 /100 | #172 | Average $39,772 |
| Canadians | 51.4 /100 | #173 | Average $39,724 |
| South Americans | 50.0 /100 | #174 | Average $39,698 |
| Immigrants | South America | 47.2 /100 | #175 | Average $39,643 |
| Nigerians | 47.0 /100 | #176 | Average $39,641 |
| Costa Ricans | 46.1 /100 | #177 | Average $39,622 |
| Slavs | 45.6 /100 | #178 | Average $39,613 |
| Immigrants | Germany | 45.1 /100 | #179 | Average $39,603 |
| Immigrants | Kenya | 41.6 /100 | #180 | Average $39,535 |
| Tsimshian | 41.4 /100 | #181 | Average $39,530 |
| Tlingit-Haida | 40.5 /100 | #182 | Average $39,513 |
| Hungarians | 40.3 /100 | #183 | Average $39,510 |
| Europeans | 37.7 /100 | #184 | Fair $39,457 |
| Immigrants | West Indies | 36.9 /100 | #185 | Fair $39,441 |
| Colombians | 36.9 /100 | #186 | Fair $39,439 |