Native/Alaskan vs Senegalese Female Poverty
COMPARE
Native/Alaskan
Senegalese
Female Poverty
Female Poverty Comparison
Natives/Alaskans
Senegalese
19.2%
FEMALE POVERTY
0.0/ 100
METRIC RATING
331st/ 347
METRIC RANK
16.5%
FEMALE POVERTY
0.0/ 100
METRIC RATING
295th/ 347
METRIC RANK
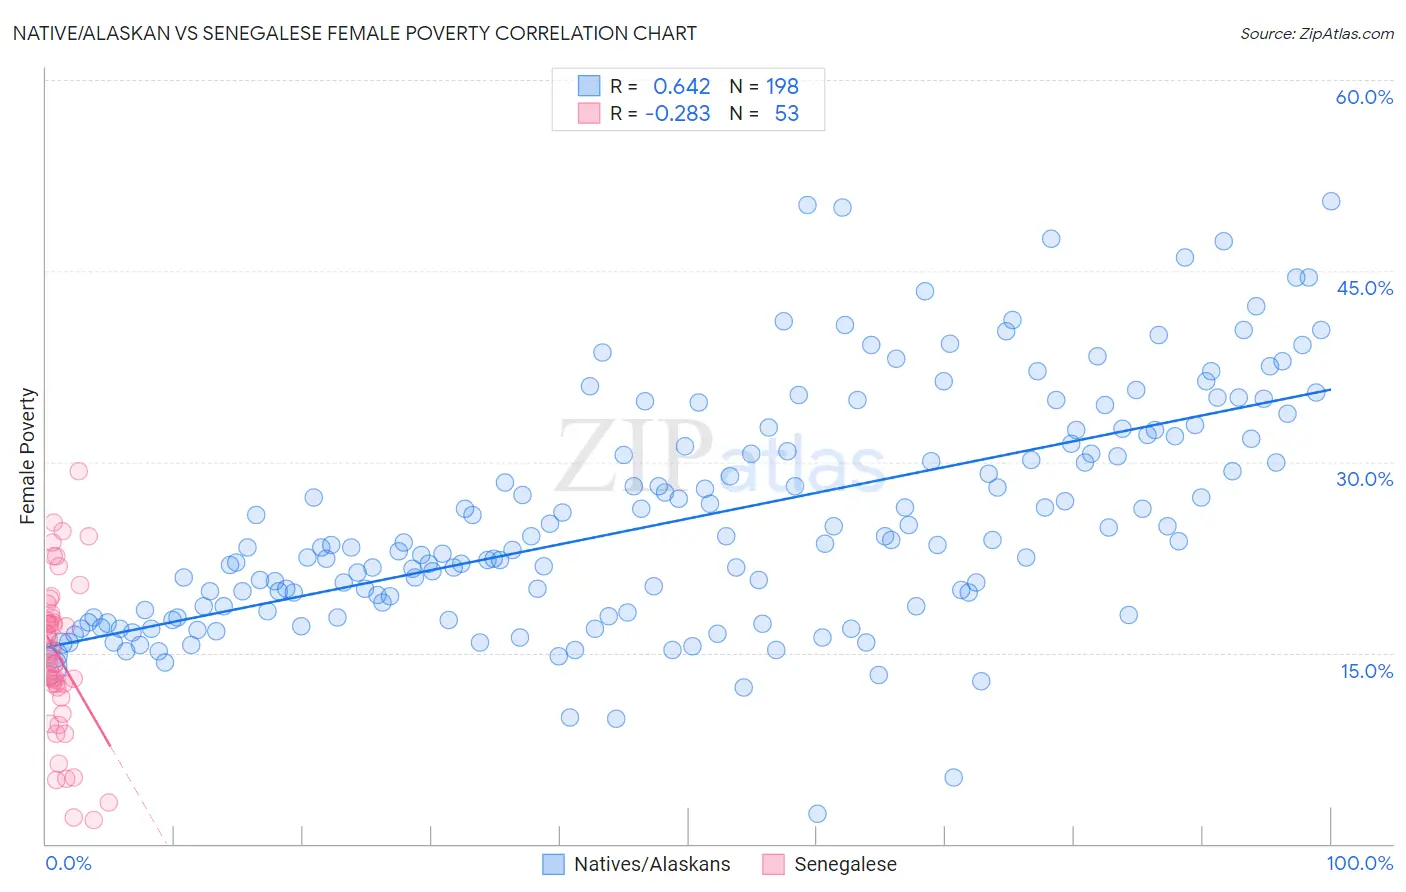
Native/Alaskan vs Senegalese Female Poverty Correlation Chart
The statistical analysis conducted on geographies consisting of 512,476,258 people shows a significant positive correlation between the proportion of Natives/Alaskans and poverty level among females in the United States with a correlation coefficient (R) of 0.642 and weighted average of 19.2%. Similarly, the statistical analysis conducted on geographies consisting of 78,099,565 people shows a weak negative correlation between the proportion of Senegalese and poverty level among females in the United States with a correlation coefficient (R) of -0.283 and weighted average of 16.5%, a difference of 16.7%.
Female Poverty Correlation Summary
| Measurement | Native/Alaskan | Senegalese |
| Minimum | 2.3% | 1.9% |
| Maximum | 50.5% | 29.2% |
| Range | 48.2% | 27.3% |
| Mean | 25.5% | 14.7% |
| Median | 23.5% | 14.5% |
| Interquartile 25% (IQ1) | 18.3% | 11.9% |
| Interquartile 75% (IQ3) | 31.8% | 17.9% |
| Interquartile Range (IQR) | 13.5% | 6.0% |
| Standard Deviation (Sample) | 9.2% | 6.1% |
| Standard Deviation (Population) | 9.1% | 6.0% |
Similar Demographics by Female Poverty
Demographics Similar to Natives/Alaskans by Female Poverty
In terms of female poverty, the demographic groups most similar to Natives/Alaskans are Apache (19.2%, a difference of 0.16%), Dominican (19.1%, a difference of 0.42%), Immigrants from Dominican Republic (19.3%, a difference of 0.76%), Kiowa (18.6%, a difference of 3.2%), and Black/African American (18.6%, a difference of 3.3%).
| Demographics | Rating | Rank | Female Poverty |
| Immigrants | Honduras | 0.0 /100 | #324 | Tragic 17.7% |
| Colville | 0.0 /100 | #325 | Tragic 17.8% |
| Central American Indians | 0.0 /100 | #326 | Tragic 18.0% |
| Yakama | 0.0 /100 | #327 | Tragic 18.0% |
| Blacks/African Americans | 0.0 /100 | #328 | Tragic 18.6% |
| Kiowa | 0.0 /100 | #329 | Tragic 18.6% |
| Dominicans | 0.0 /100 | #330 | Tragic 19.1% |
| Natives/Alaskans | 0.0 /100 | #331 | Tragic 19.2% |
| Apache | 0.0 /100 | #332 | Tragic 19.2% |
| Immigrants | Dominican Republic | 0.0 /100 | #333 | Tragic 19.3% |
| Houma | 0.0 /100 | #334 | Tragic 20.0% |
| Cheyenne | 0.0 /100 | #335 | Tragic 20.2% |
| Pueblo | 0.0 /100 | #336 | Tragic 20.7% |
| Yuman | 0.0 /100 | #337 | Tragic 20.8% |
| Sioux | 0.0 /100 | #338 | Tragic 20.9% |
Demographics Similar to Senegalese by Female Poverty
In terms of female poverty, the demographic groups most similar to Senegalese are Immigrants from Senegal (16.5%, a difference of 0.020%), Immigrants from Cabo Verde (16.4%, a difference of 0.080%), Immigrants from Latin America (16.4%, a difference of 0.11%), Immigrants from Zaire (16.4%, a difference of 0.17%), and Yaqui (16.4%, a difference of 0.18%).
| Demographics | Rating | Rank | Female Poverty |
| Indonesians | 0.0 /100 | #288 | Tragic 16.4% |
| Blackfeet | 0.0 /100 | #289 | Tragic 16.4% |
| Immigrants | Bangladesh | 0.0 /100 | #290 | Tragic 16.4% |
| Yaqui | 0.0 /100 | #291 | Tragic 16.4% |
| Immigrants | Zaire | 0.0 /100 | #292 | Tragic 16.4% |
| Immigrants | Latin America | 0.0 /100 | #293 | Tragic 16.4% |
| Immigrants | Cabo Verde | 0.0 /100 | #294 | Tragic 16.4% |
| Senegalese | 0.0 /100 | #295 | Tragic 16.5% |
| Immigrants | Senegal | 0.0 /100 | #296 | Tragic 16.5% |
| Mexicans | 0.0 /100 | #297 | Tragic 16.5% |
| Somalis | 0.0 /100 | #298 | Tragic 16.6% |
| Hispanics or Latinos | 0.0 /100 | #299 | Tragic 16.6% |
| Bahamians | 0.0 /100 | #300 | Tragic 16.6% |
| Guatemalans | 0.0 /100 | #301 | Tragic 16.7% |
| Chippewa | 0.0 /100 | #302 | Tragic 16.7% |