Native/Alaskan vs Senegalese Vision Disability
COMPARE
Native/Alaskan
Senegalese
Vision Disability
Vision Disability Comparison
Natives/Alaskans
Senegalese
3.0%
VISION DISABILITY
0.0/ 100
METRIC RATING
327th/ 347
METRIC RANK
2.4%
VISION DISABILITY
0.1/ 100
METRIC RATING
268th/ 347
METRIC RANK
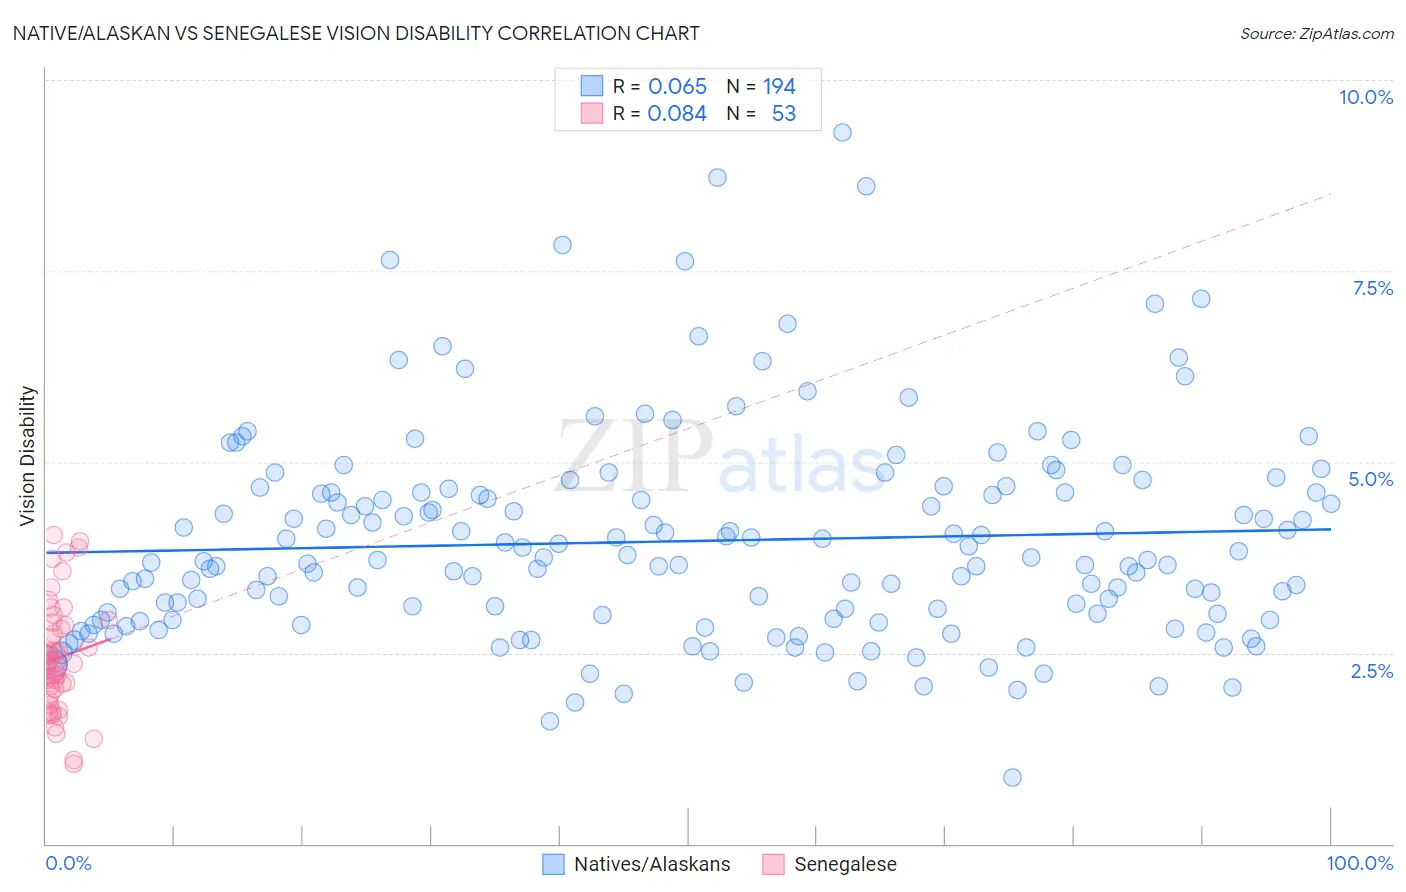
Native/Alaskan vs Senegalese Vision Disability Correlation Chart
The statistical analysis conducted on geographies consisting of 512,205,418 people shows a slight positive correlation between the proportion of Natives/Alaskans and percentage of population with vision disability in the United States with a correlation coefficient (R) of 0.065 and weighted average of 3.0%. Similarly, the statistical analysis conducted on geographies consisting of 78,129,878 people shows a slight positive correlation between the proportion of Senegalese and percentage of population with vision disability in the United States with a correlation coefficient (R) of 0.084 and weighted average of 2.4%, a difference of 23.6%.
Vision Disability Correlation Summary
| Measurement | Native/Alaskan | Senegalese |
| Minimum | 0.86% | 1.0% |
| Maximum | 9.3% | 4.0% |
| Range | 8.5% | 3.0% |
| Mean | 4.0% | 2.4% |
| Median | 3.7% | 2.4% |
| Interquartile 25% (IQ1) | 2.9% | 1.9% |
| Interquartile 75% (IQ3) | 4.6% | 2.9% |
| Interquartile Range (IQR) | 1.7% | 0.95% |
| Standard Deviation (Sample) | 1.4% | 0.72% |
| Standard Deviation (Population) | 1.4% | 0.72% |
Similar Demographics by Vision Disability
Demographics Similar to Natives/Alaskans by Vision Disability
In terms of vision disability, the demographic groups most similar to Natives/Alaskans are Yuman (3.0%, a difference of 0.54%), Apache (3.0%, a difference of 0.74%), Spanish American (2.9%, a difference of 0.80%), Colville (3.0%, a difference of 1.9%), and Cherokee (2.9%, a difference of 2.0%).
| Demographics | Rating | Rank | Vision Disability |
| Blacks/African Americans | 0.0 /100 | #320 | Tragic 2.8% |
| Comanche | 0.0 /100 | #321 | Tragic 2.8% |
| Paiute | 0.0 /100 | #322 | Tragic 2.9% |
| Tlingit-Haida | 0.0 /100 | #323 | Tragic 2.9% |
| Hopi | 0.0 /100 | #324 | Tragic 2.9% |
| Cherokee | 0.0 /100 | #325 | Tragic 2.9% |
| Spanish Americans | 0.0 /100 | #326 | Tragic 2.9% |
| Natives/Alaskans | 0.0 /100 | #327 | Tragic 3.0% |
| Yuman | 0.0 /100 | #328 | Tragic 3.0% |
| Apache | 0.0 /100 | #329 | Tragic 3.0% |
| Colville | 0.0 /100 | #330 | Tragic 3.0% |
| Central American Indians | 0.0 /100 | #331 | Tragic 3.0% |
| Seminole | 0.0 /100 | #332 | Tragic 3.1% |
| Cajuns | 0.0 /100 | #333 | Tragic 3.1% |
| Cheyenne | 0.0 /100 | #334 | Tragic 3.1% |
Demographics Similar to Senegalese by Vision Disability
In terms of vision disability, the demographic groups most similar to Senegalese are Ute (2.4%, a difference of 0.090%), Mexican American Indian (2.4%, a difference of 0.10%), Immigrants from Jamaica (2.4%, a difference of 0.14%), Immigrants from Liberia (2.4%, a difference of 0.16%), and Celtic (2.4%, a difference of 0.27%).
| Demographics | Rating | Rank | Vision Disability |
| Fijians | 0.1 /100 | #261 | Tragic 2.4% |
| Jamaicans | 0.1 /100 | #262 | Tragic 2.4% |
| Immigrants | Belize | 0.1 /100 | #263 | Tragic 2.4% |
| Immigrants | Liberia | 0.1 /100 | #264 | Tragic 2.4% |
| Immigrants | Jamaica | 0.1 /100 | #265 | Tragic 2.4% |
| Mexican American Indians | 0.1 /100 | #266 | Tragic 2.4% |
| Ute | 0.1 /100 | #267 | Tragic 2.4% |
| Senegalese | 0.1 /100 | #268 | Tragic 2.4% |
| Celtics | 0.1 /100 | #269 | Tragic 2.4% |
| Cubans | 0.1 /100 | #270 | Tragic 2.4% |
| Immigrants | Azores | 0.1 /100 | #271 | Tragic 2.4% |
| Spaniards | 0.1 /100 | #272 | Tragic 2.4% |
| Immigrants | Bahamas | 0.1 /100 | #273 | Tragic 2.4% |
| Immigrants | Latin America | 0.0 /100 | #274 | Tragic 2.4% |
| Chippewa | 0.0 /100 | #275 | Tragic 2.4% |