Assyrian/Chaldean/Syriac vs Norwegian Householder Income Over 65 years
COMPARE
Assyrian/Chaldean/Syriac
Norwegian
Householder Income Over 65 years
Householder Income Over 65 years Comparison
Assyrians/Chaldeans/Syriacs
Norwegians
$64,108
HOUSEHOLDER INCOME OVER 65 YEARS
96.4/ 100
METRIC RATING
99th/ 347
METRIC RANK
$61,104
HOUSEHOLDER INCOME OVER 65 YEARS
53.6/ 100
METRIC RATING
167th/ 347
METRIC RANK
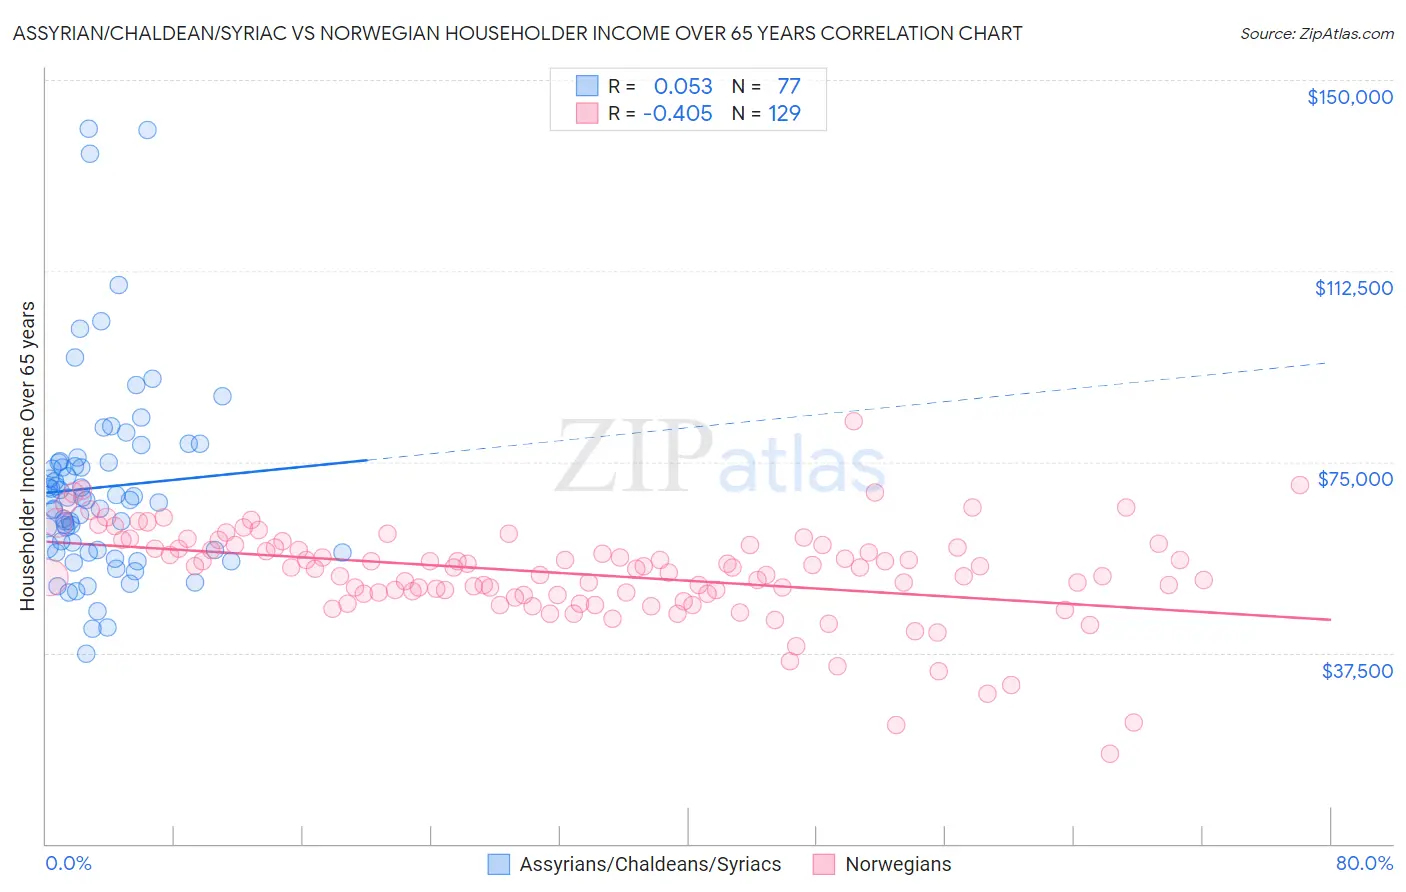
Assyrian/Chaldean/Syriac vs Norwegian Householder Income Over 65 years Correlation Chart
The statistical analysis conducted on geographies consisting of 110,223,664 people shows a slight positive correlation between the proportion of Assyrians/Chaldeans/Syriacs and household income with householder over the age of 65 in the United States with a correlation coefficient (R) of 0.053 and weighted average of $64,108. Similarly, the statistical analysis conducted on geographies consisting of 529,627,922 people shows a moderate negative correlation between the proportion of Norwegians and household income with householder over the age of 65 in the United States with a correlation coefficient (R) of -0.405 and weighted average of $61,104, a difference of 4.9%.
Householder Income Over 65 years Correlation Summary
| Measurement | Assyrian/Chaldean/Syriac | Norwegian |
| Minimum | $37,310 | $17,624 |
| Maximum | $140,431 | $83,083 |
| Range | $103,121 | $65,458 |
| Mean | $70,014 | $53,000 |
| Median | $67,459 | $54,270 |
| Interquartile 25% (IQ1) | $57,422 | $49,000 |
| Interquartile 75% (IQ3) | $75,038 | $58,423 |
| Interquartile Range (IQR) | $17,616 | $9,422 |
| Standard Deviation (Sample) | $19,596 | $9,391 |
| Standard Deviation (Population) | $19,468 | $9,355 |
Similar Demographics by Householder Income Over 65 years
Demographics Similar to Assyrians/Chaldeans/Syriacs by Householder Income Over 65 years
In terms of householder income over 65 years, the demographic groups most similar to Assyrians/Chaldeans/Syriacs are Immigrants from South Eastern Asia ($64,089, a difference of 0.030%), Romanian ($64,142, a difference of 0.050%), Immigrants from Italy ($64,065, a difference of 0.070%), Sri Lankan ($64,201, a difference of 0.14%), and Chilean ($63,957, a difference of 0.24%).
| Demographics | Rating | Rank | Householder Income Over 65 years |
| Immigrants | Bulgaria | 97.3 /100 | #92 | Exceptional $64,379 |
| Jordanians | 97.1 /100 | #93 | Exceptional $64,313 |
| Immigrants | Egypt | 97.0 /100 | #94 | Exceptional $64,299 |
| Immigrants | Latvia | 97.0 /100 | #95 | Exceptional $64,298 |
| Immigrants | Hungary | 97.0 /100 | #96 | Exceptional $64,277 |
| Sri Lankans | 96.7 /100 | #97 | Exceptional $64,201 |
| Romanians | 96.5 /100 | #98 | Exceptional $64,142 |
| Assyrians/Chaldeans/Syriacs | 96.4 /100 | #99 | Exceptional $64,108 |
| Immigrants | South Eastern Asia | 96.3 /100 | #100 | Exceptional $64,089 |
| Immigrants | Italy | 96.2 /100 | #101 | Exceptional $64,065 |
| Chileans | 95.8 /100 | #102 | Exceptional $63,957 |
| British | 95.7 /100 | #103 | Exceptional $63,940 |
| Immigrants | Cameroon | 95.6 /100 | #104 | Exceptional $63,907 |
| Italians | 95.5 /100 | #105 | Exceptional $63,885 |
| Immigrants | Argentina | 95.5 /100 | #106 | Exceptional $63,885 |
Demographics Similar to Norwegians by Householder Income Over 65 years
In terms of householder income over 65 years, the demographic groups most similar to Norwegians are Irish ($61,097, a difference of 0.010%), Carpatho Rusyn ($61,093, a difference of 0.020%), Serbian ($61,087, a difference of 0.030%), Inupiat ($61,061, a difference of 0.070%), and Immigrants from Eastern Africa ($61,157, a difference of 0.090%).
| Demographics | Rating | Rank | Householder Income Over 65 years |
| Portuguese | 62.1 /100 | #160 | Good $61,440 |
| Icelanders | 57.9 /100 | #161 | Average $61,270 |
| Czechs | 57.2 /100 | #162 | Average $61,244 |
| Ugandans | 55.5 /100 | #163 | Average $61,177 |
| Immigrants | North Macedonia | 55.4 /100 | #164 | Average $61,175 |
| Immigrants | Ukraine | 55.1 /100 | #165 | Average $61,163 |
| Immigrants | Eastern Africa | 55.0 /100 | #166 | Average $61,157 |
| Norwegians | 53.6 /100 | #167 | Average $61,104 |
| Irish | 53.4 /100 | #168 | Average $61,097 |
| Carpatho Rusyns | 53.3 /100 | #169 | Average $61,093 |
| Serbians | 53.1 /100 | #170 | Average $61,087 |
| Inupiat | 52.4 /100 | #171 | Average $61,061 |
| Immigrants | Poland | 51.9 /100 | #172 | Average $61,041 |
| Immigrants | Micronesia | 50.8 /100 | #173 | Average $61,000 |
| Luxembourgers | 50.0 /100 | #174 | Average $60,967 |