Immigrants from Guyana vs Norwegian Householder Income Over 65 years
COMPARE
Immigrants from Guyana
Norwegian
Householder Income Over 65 years
Householder Income Over 65 years Comparison
Immigrants from Guyana
Norwegians
$56,495
HOUSEHOLDER INCOME OVER 65 YEARS
0.9/ 100
METRIC RATING
241st/ 347
METRIC RANK
$61,104
HOUSEHOLDER INCOME OVER 65 YEARS
53.6/ 100
METRIC RATING
167th/ 347
METRIC RANK
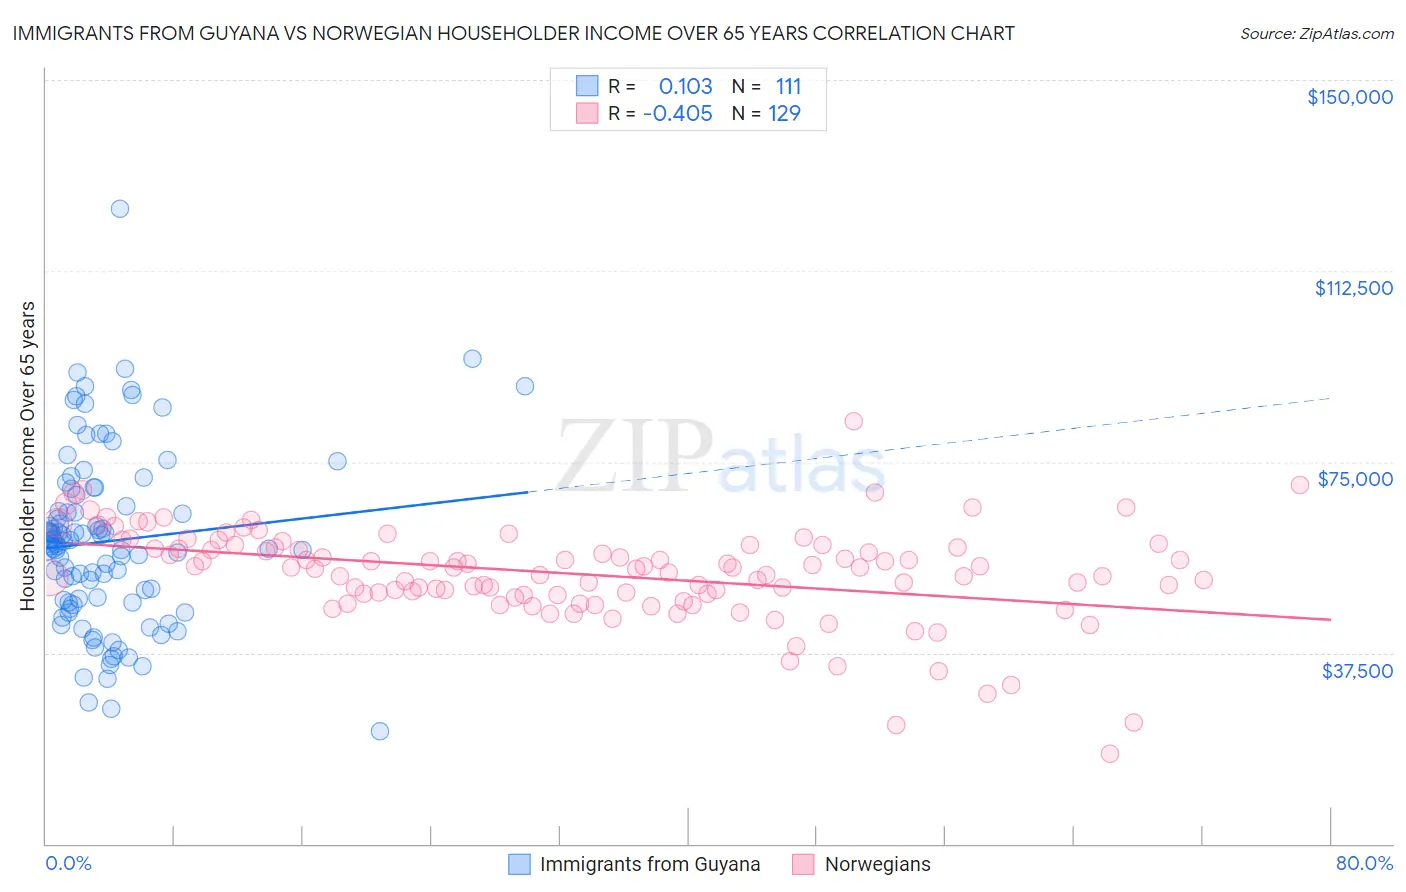
Immigrants from Guyana vs Norwegian Householder Income Over 65 years Correlation Chart
The statistical analysis conducted on geographies consisting of 183,323,030 people shows a poor positive correlation between the proportion of Immigrants from Guyana and household income with householder over the age of 65 in the United States with a correlation coefficient (R) of 0.103 and weighted average of $56,495. Similarly, the statistical analysis conducted on geographies consisting of 529,627,922 people shows a moderate negative correlation between the proportion of Norwegians and household income with householder over the age of 65 in the United States with a correlation coefficient (R) of -0.405 and weighted average of $61,104, a difference of 8.2%.
Householder Income Over 65 years Correlation Summary
| Measurement | Immigrants from Guyana | Norwegian |
| Minimum | $22,090 | $17,624 |
| Maximum | $124,816 | $83,083 |
| Range | $102,726 | $65,458 |
| Mean | $59,437 | $53,000 |
| Median | $58,833 | $54,270 |
| Interquartile 25% (IQ1) | $47,500 | $49,000 |
| Interquartile 75% (IQ3) | $68,572 | $58,423 |
| Interquartile Range (IQR) | $21,072 | $9,422 |
| Standard Deviation (Sample) | $17,169 | $9,391 |
| Standard Deviation (Population) | $17,091 | $9,355 |
Similar Demographics by Householder Income Over 65 years
Demographics Similar to Immigrants from Guyana by Householder Income Over 65 years
In terms of householder income over 65 years, the demographic groups most similar to Immigrants from Guyana are Yaqui ($56,417, a difference of 0.14%), Subsaharan African ($56,615, a difference of 0.21%), Guyanese ($56,351, a difference of 0.26%), Hmong ($56,339, a difference of 0.28%), and Immigrants from Uzbekistan ($56,331, a difference of 0.29%).
| Demographics | Rating | Rank | Householder Income Over 65 years |
| Immigrants | Burma/Myanmar | 1.7 /100 | #234 | Tragic $57,114 |
| Spanish Americans | 1.6 /100 | #235 | Tragic $57,021 |
| Immigrants | Uruguay | 1.5 /100 | #236 | Tragic $56,975 |
| Immigrants | Panama | 1.5 /100 | #237 | Tragic $56,944 |
| Fijians | 1.2 /100 | #238 | Tragic $56,768 |
| Immigrants | Laos | 1.2 /100 | #239 | Tragic $56,722 |
| Sub-Saharan Africans | 1.0 /100 | #240 | Tragic $56,615 |
| Immigrants | Guyana | 0.9 /100 | #241 | Tragic $56,495 |
| Yaqui | 0.8 /100 | #242 | Tragic $56,417 |
| Guyanese | 0.8 /100 | #243 | Tragic $56,351 |
| Hmong | 0.8 /100 | #244 | Tragic $56,339 |
| Immigrants | Uzbekistan | 0.8 /100 | #245 | Tragic $56,331 |
| Central Americans | 0.8 /100 | #246 | Tragic $56,321 |
| Yakama | 0.7 /100 | #247 | Tragic $56,234 |
| Vietnamese | 0.6 /100 | #248 | Tragic $56,143 |
Demographics Similar to Norwegians by Householder Income Over 65 years
In terms of householder income over 65 years, the demographic groups most similar to Norwegians are Irish ($61,097, a difference of 0.010%), Carpatho Rusyn ($61,093, a difference of 0.020%), Serbian ($61,087, a difference of 0.030%), Inupiat ($61,061, a difference of 0.070%), and Immigrants from Eastern Africa ($61,157, a difference of 0.090%).
| Demographics | Rating | Rank | Householder Income Over 65 years |
| Portuguese | 62.1 /100 | #160 | Good $61,440 |
| Icelanders | 57.9 /100 | #161 | Average $61,270 |
| Czechs | 57.2 /100 | #162 | Average $61,244 |
| Ugandans | 55.5 /100 | #163 | Average $61,177 |
| Immigrants | North Macedonia | 55.4 /100 | #164 | Average $61,175 |
| Immigrants | Ukraine | 55.1 /100 | #165 | Average $61,163 |
| Immigrants | Eastern Africa | 55.0 /100 | #166 | Average $61,157 |
| Norwegians | 53.6 /100 | #167 | Average $61,104 |
| Irish | 53.4 /100 | #168 | Average $61,097 |
| Carpatho Rusyns | 53.3 /100 | #169 | Average $61,093 |
| Serbians | 53.1 /100 | #170 | Average $61,087 |
| Inupiat | 52.4 /100 | #171 | Average $61,061 |
| Immigrants | Poland | 51.9 /100 | #172 | Average $61,041 |
| Immigrants | Micronesia | 50.8 /100 | #173 | Average $61,000 |
| Luxembourgers | 50.0 /100 | #174 | Average $60,967 |