Immigrants from China vs Norwegian Householder Income Over 65 years
COMPARE
Immigrants from China
Norwegian
Householder Income Over 65 years
Householder Income Over 65 years Comparison
Immigrants from China
Norwegians
$69,174
HOUSEHOLDER INCOME OVER 65 YEARS
100.0/ 100
METRIC RATING
28th/ 347
METRIC RANK
$61,104
HOUSEHOLDER INCOME OVER 65 YEARS
53.6/ 100
METRIC RATING
167th/ 347
METRIC RANK
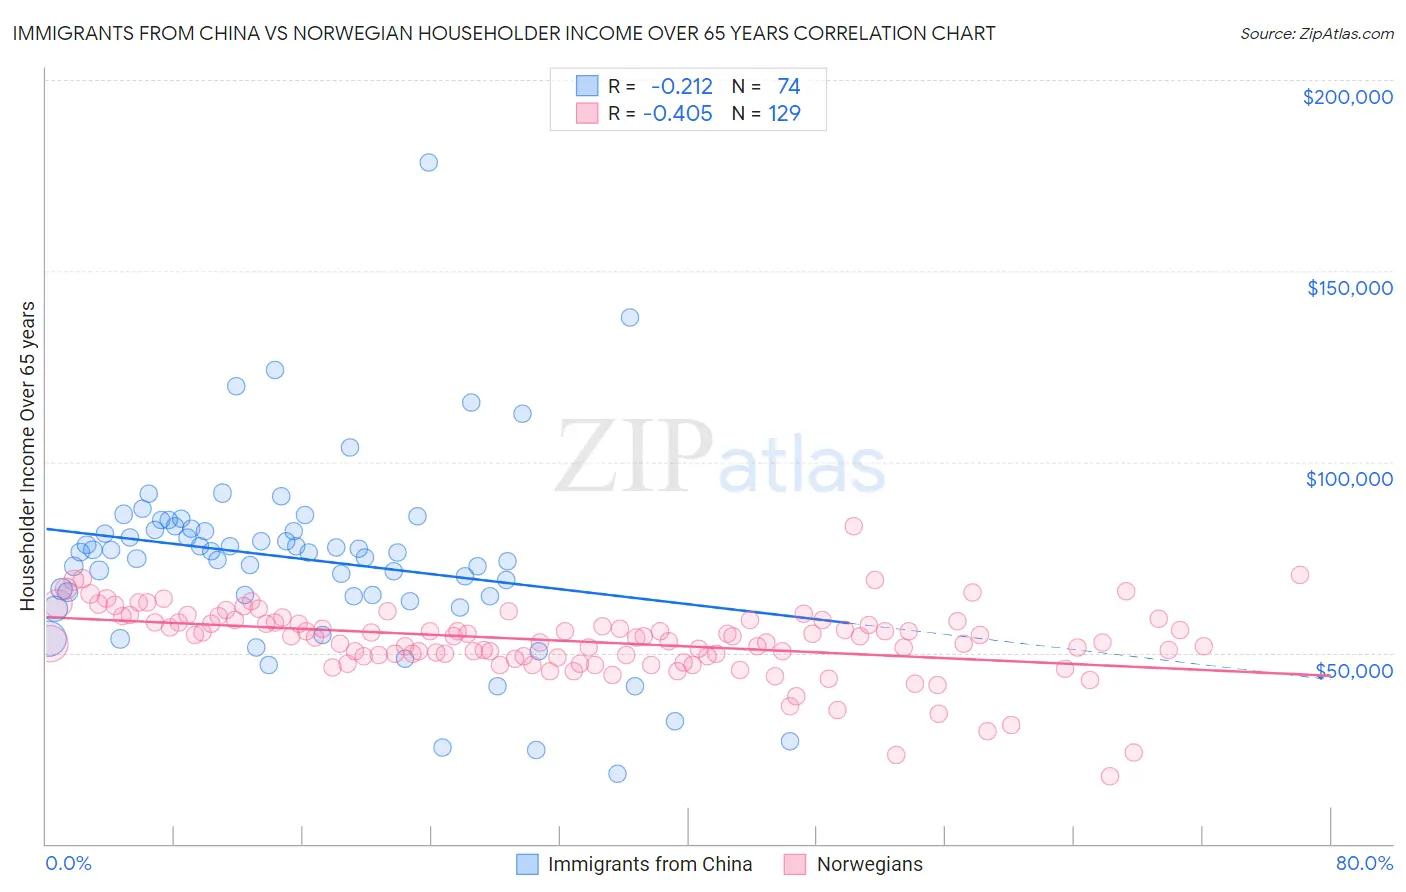
Immigrants from China vs Norwegian Householder Income Over 65 years Correlation Chart
The statistical analysis conducted on geographies consisting of 454,893,512 people shows a weak negative correlation between the proportion of Immigrants from China and household income with householder over the age of 65 in the United States with a correlation coefficient (R) of -0.212 and weighted average of $69,174. Similarly, the statistical analysis conducted on geographies consisting of 529,627,922 people shows a moderate negative correlation between the proportion of Norwegians and household income with householder over the age of 65 in the United States with a correlation coefficient (R) of -0.405 and weighted average of $61,104, a difference of 13.2%.
Householder Income Over 65 years Correlation Summary
| Measurement | Immigrants from China | Norwegian |
| Minimum | $18,324 | $17,624 |
| Maximum | $178,333 | $83,083 |
| Range | $160,009 | $65,458 |
| Mean | $74,620 | $53,000 |
| Median | $76,354 | $54,270 |
| Interquartile 25% (IQ1) | $64,801 | $49,000 |
| Interquartile 75% (IQ3) | $82,502 | $58,423 |
| Interquartile Range (IQR) | $17,701 | $9,422 |
| Standard Deviation (Sample) | $24,782 | $9,391 |
| Standard Deviation (Population) | $24,614 | $9,355 |
Similar Demographics by Householder Income Over 65 years
Demographics Similar to Immigrants from China by Householder Income Over 65 years
In terms of householder income over 65 years, the demographic groups most similar to Immigrants from China are Immigrants from Australia ($69,164, a difference of 0.010%), Immigrants from Switzerland ($69,343, a difference of 0.25%), Immigrants from Northern Europe ($69,003, a difference of 0.25%), Afghan ($68,951, a difference of 0.32%), and Immigrants from Sri Lanka ($69,426, a difference of 0.37%).
| Demographics | Rating | Rank | Householder Income Over 65 years |
| Immigrants | Eastern Asia | 100.0 /100 | #21 | Exceptional $69,872 |
| Immigrants | Israel | 100.0 /100 | #22 | Exceptional $69,857 |
| Immigrants | Japan | 100.0 /100 | #23 | Exceptional $69,774 |
| Immigrants | Sweden | 100.0 /100 | #24 | Exceptional $69,722 |
| Immigrants | Belgium | 100.0 /100 | #25 | Exceptional $69,703 |
| Immigrants | Sri Lanka | 100.0 /100 | #26 | Exceptional $69,426 |
| Immigrants | Switzerland | 100.0 /100 | #27 | Exceptional $69,343 |
| Immigrants | China | 100.0 /100 | #28 | Exceptional $69,174 |
| Immigrants | Australia | 100.0 /100 | #29 | Exceptional $69,164 |
| Immigrants | Northern Europe | 100.0 /100 | #30 | Exceptional $69,003 |
| Afghans | 100.0 /100 | #31 | Exceptional $68,951 |
| Asians | 100.0 /100 | #32 | Exceptional $68,822 |
| Immigrants | Denmark | 100.0 /100 | #33 | Exceptional $68,801 |
| Immigrants | Ireland | 100.0 /100 | #34 | Exceptional $68,495 |
| Tongans | 100.0 /100 | #35 | Exceptional $68,235 |
Demographics Similar to Norwegians by Householder Income Over 65 years
In terms of householder income over 65 years, the demographic groups most similar to Norwegians are Irish ($61,097, a difference of 0.010%), Carpatho Rusyn ($61,093, a difference of 0.020%), Serbian ($61,087, a difference of 0.030%), Inupiat ($61,061, a difference of 0.070%), and Immigrants from Eastern Africa ($61,157, a difference of 0.090%).
| Demographics | Rating | Rank | Householder Income Over 65 years |
| Portuguese | 62.1 /100 | #160 | Good $61,440 |
| Icelanders | 57.9 /100 | #161 | Average $61,270 |
| Czechs | 57.2 /100 | #162 | Average $61,244 |
| Ugandans | 55.5 /100 | #163 | Average $61,177 |
| Immigrants | North Macedonia | 55.4 /100 | #164 | Average $61,175 |
| Immigrants | Ukraine | 55.1 /100 | #165 | Average $61,163 |
| Immigrants | Eastern Africa | 55.0 /100 | #166 | Average $61,157 |
| Norwegians | 53.6 /100 | #167 | Average $61,104 |
| Irish | 53.4 /100 | #168 | Average $61,097 |
| Carpatho Rusyns | 53.3 /100 | #169 | Average $61,093 |
| Serbians | 53.1 /100 | #170 | Average $61,087 |
| Inupiat | 52.4 /100 | #171 | Average $61,061 |
| Immigrants | Poland | 51.9 /100 | #172 | Average $61,041 |
| Immigrants | Micronesia | 50.8 /100 | #173 | Average $61,000 |
| Luxembourgers | 50.0 /100 | #174 | Average $60,967 |