Native/Alaskan vs Maltese Poverty
COMPARE
Native/Alaskan
Maltese
Poverty
Poverty Comparison
Natives/Alaskans
Maltese
18.1%
POVERTY
0.0/ 100
METRIC RATING
332nd/ 347
METRIC RANK
10.2%
POVERTY
99.9/ 100
METRIC RATING
8th/ 347
METRIC RANK
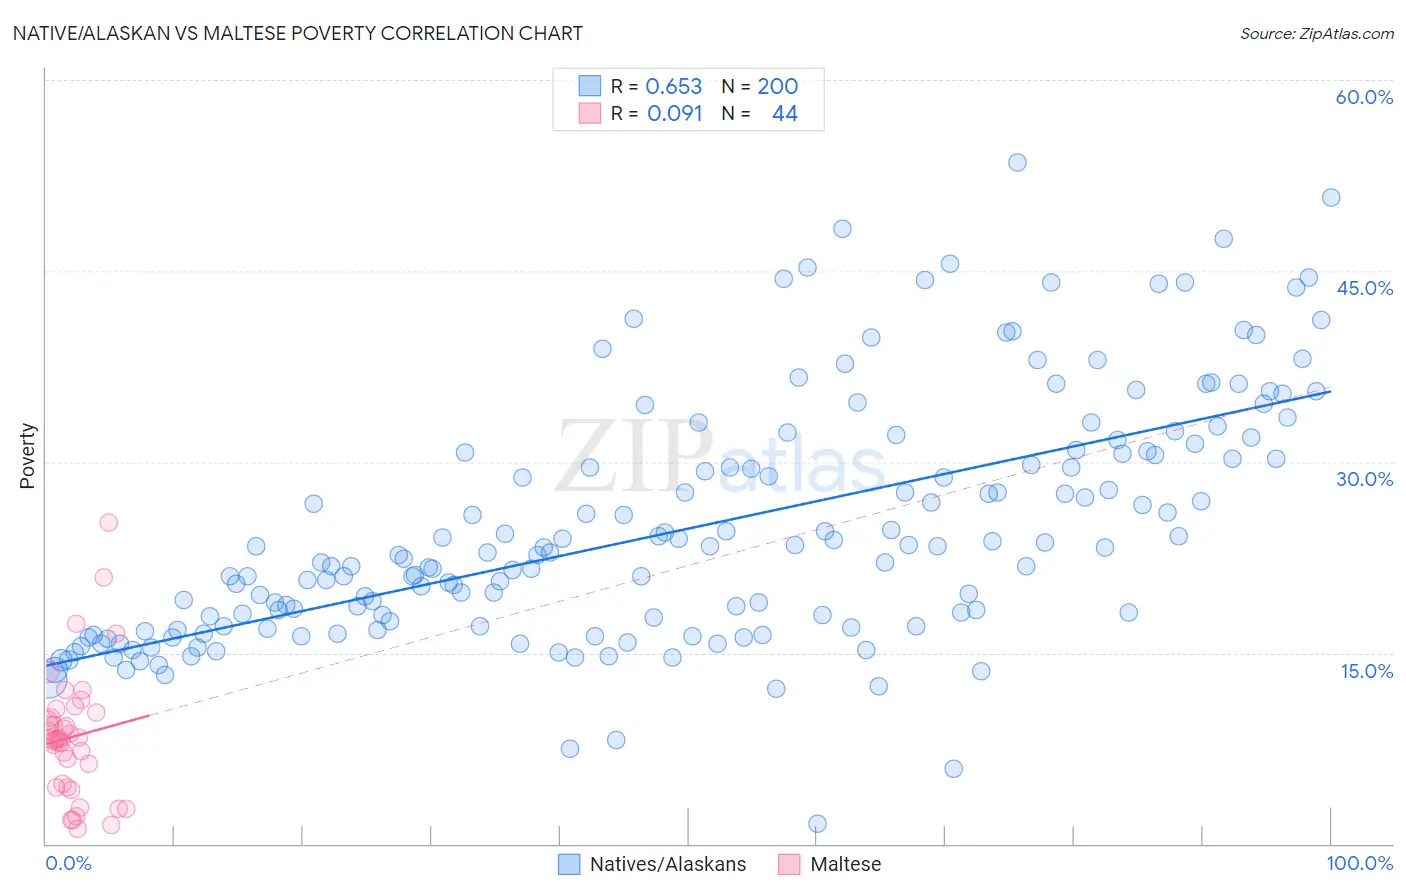
Native/Alaskan vs Maltese Poverty Correlation Chart
The statistical analysis conducted on geographies consisting of 512,638,915 people shows a significant positive correlation between the proportion of Natives/Alaskans and poverty level in the United States with a correlation coefficient (R) of 0.653 and weighted average of 18.1%. Similarly, the statistical analysis conducted on geographies consisting of 126,440,716 people shows a slight positive correlation between the proportion of Maltese and poverty level in the United States with a correlation coefficient (R) of 0.091 and weighted average of 10.2%, a difference of 77.8%.
Poverty Correlation Summary
| Measurement | Native/Alaskan | Maltese |
| Minimum | 1.6% | 1.2% |
| Maximum | 53.5% | 25.2% |
| Range | 51.9% | 24.1% |
| Mean | 24.8% | 8.4% |
| Median | 22.8% | 8.2% |
| Interquartile 25% (IQ1) | 17.1% | 4.6% |
| Interquartile 75% (IQ3) | 30.7% | 10.1% |
| Interquartile Range (IQR) | 13.6% | 5.5% |
| Standard Deviation (Sample) | 9.6% | 5.0% |
| Standard Deviation (Population) | 9.5% | 4.9% |
Similar Demographics by Poverty
Demographics Similar to Natives/Alaskans by Poverty
In terms of poverty, the demographic groups most similar to Natives/Alaskans are Immigrants from Dominican Republic (17.8%, a difference of 1.4%), Houma (18.4%, a difference of 2.0%), Apache (18.4%, a difference of 2.0%), Dominican (17.6%, a difference of 2.4%), and Black/African American (17.3%, a difference of 4.7%).
| Demographics | Rating | Rank | Poverty |
| Central American Indians | 0.0 /100 | #325 | Tragic 16.7% |
| Paiute | 0.0 /100 | #326 | Tragic 16.7% |
| Kiowa | 0.0 /100 | #327 | Tragic 16.8% |
| Ute | 0.0 /100 | #328 | Tragic 16.9% |
| Blacks/African Americans | 0.0 /100 | #329 | Tragic 17.3% |
| Dominicans | 0.0 /100 | #330 | Tragic 17.6% |
| Immigrants | Dominican Republic | 0.0 /100 | #331 | Tragic 17.8% |
| Natives/Alaskans | 0.0 /100 | #332 | Tragic 18.1% |
| Houma | 0.0 /100 | #333 | Tragic 18.4% |
| Apache | 0.0 /100 | #334 | Tragic 18.4% |
| Cheyenne | 0.0 /100 | #335 | Tragic 18.9% |
| Pueblo | 0.0 /100 | #336 | Tragic 19.4% |
| Sioux | 0.0 /100 | #337 | Tragic 19.8% |
| Yuman | 0.0 /100 | #338 | Tragic 20.2% |
| Crow | 0.0 /100 | #339 | Tragic 20.7% |
Demographics Similar to Maltese by Poverty
In terms of poverty, the demographic groups most similar to Maltese are Filipino (10.1%, a difference of 0.42%), Immigrants from South Central Asia (10.2%, a difference of 0.45%), Assyrian/Chaldean/Syriac (10.1%, a difference of 0.56%), Immigrants from Ireland (10.1%, a difference of 0.74%), and Bulgarian (10.2%, a difference of 0.86%).
| Demographics | Rating | Rank | Poverty |
| Immigrants | India | 100.0 /100 | #1 | Exceptional 9.0% |
| Chinese | 100.0 /100 | #2 | Exceptional 9.5% |
| Thais | 100.0 /100 | #3 | Exceptional 9.6% |
| Immigrants | Taiwan | 100.0 /100 | #4 | Exceptional 9.7% |
| Immigrants | Ireland | 99.9 /100 | #5 | Exceptional 10.1% |
| Assyrians/Chaldeans/Syriacs | 99.9 /100 | #6 | Exceptional 10.1% |
| Filipinos | 99.9 /100 | #7 | Exceptional 10.1% |
| Maltese | 99.9 /100 | #8 | Exceptional 10.2% |
| Immigrants | South Central Asia | 99.9 /100 | #9 | Exceptional 10.2% |
| Bulgarians | 99.9 /100 | #10 | Exceptional 10.2% |
| Immigrants | Lithuania | 99.9 /100 | #11 | Exceptional 10.3% |
| Bhutanese | 99.8 /100 | #12 | Exceptional 10.4% |
| Immigrants | Hong Kong | 99.8 /100 | #13 | Exceptional 10.4% |
| Immigrants | Bolivia | 99.8 /100 | #14 | Exceptional 10.4% |
| Bolivians | 99.8 /100 | #15 | Exceptional 10.4% |