Native/Alaskan vs Basque Disability Age 65 to 74
COMPARE
Native/Alaskan
Basque
Disability Age 65 to 74
Disability Age 65 to 74 Comparison
Natives/Alaskans
Basques
30.4%
DISABILITY AGE 65 TO 74
0.0/ 100
METRIC RATING
332nd/ 347
METRIC RANK
23.5%
DISABILITY AGE 65 TO 74
38.4/ 100
METRIC RATING
186th/ 347
METRIC RANK
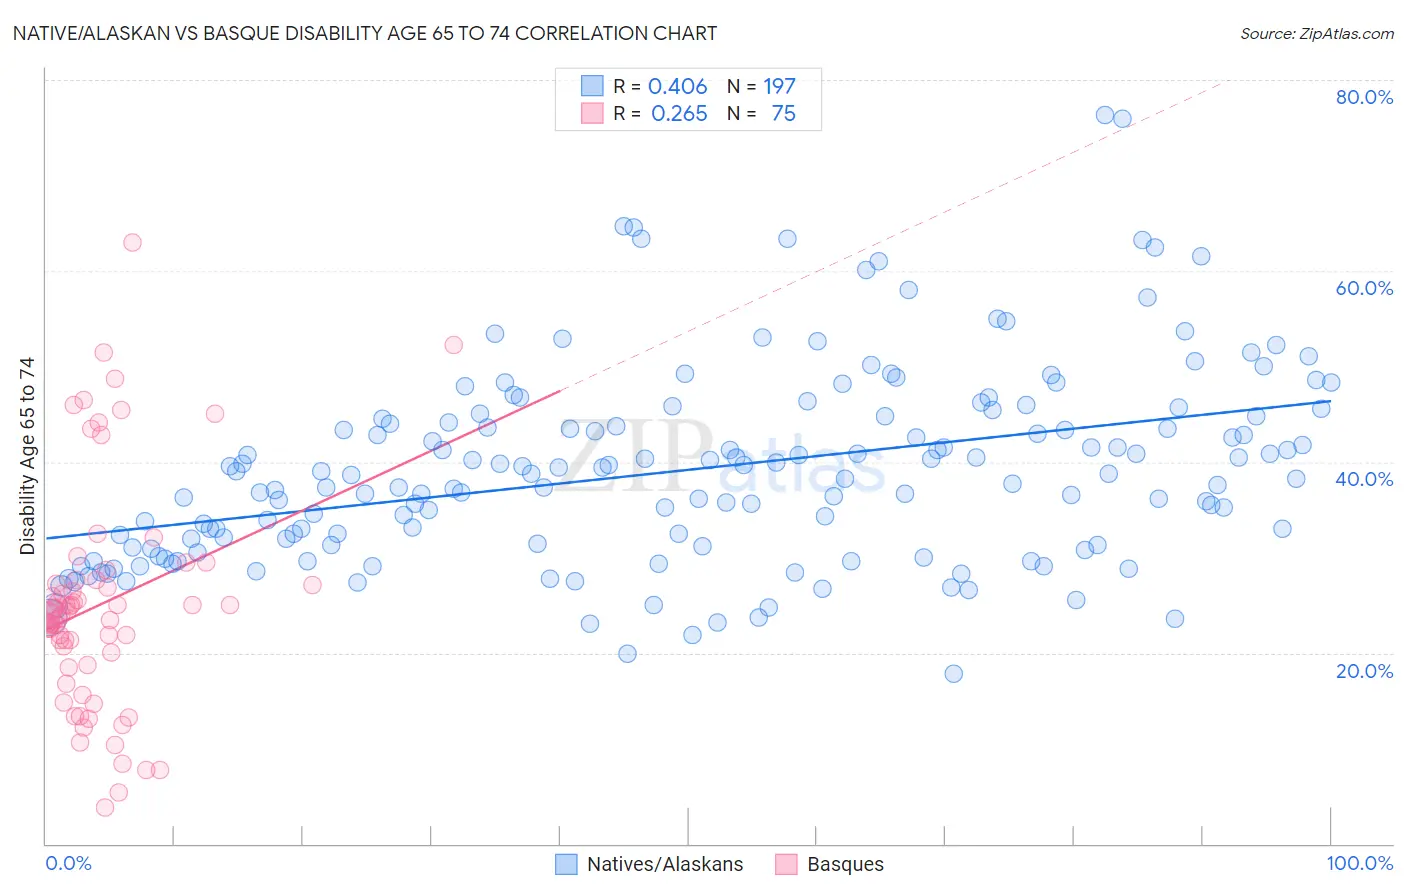
Native/Alaskan vs Basque Disability Age 65 to 74 Correlation Chart
The statistical analysis conducted on geographies consisting of 511,555,776 people shows a moderate positive correlation between the proportion of Natives/Alaskans and percentage of population with a disability between the ages 65 and 75 in the United States with a correlation coefficient (R) of 0.406 and weighted average of 30.4%. Similarly, the statistical analysis conducted on geographies consisting of 165,654,682 people shows a weak positive correlation between the proportion of Basques and percentage of population with a disability between the ages 65 and 75 in the United States with a correlation coefficient (R) of 0.265 and weighted average of 23.5%, a difference of 29.3%.
Disability Age 65 to 74 Correlation Summary
| Measurement | Native/Alaskan | Basque |
| Minimum | 17.9% | 3.8% |
| Maximum | 76.4% | 63.0% |
| Range | 58.5% | 59.1% |
| Mean | 39.2% | 25.1% |
| Median | 38.6% | 24.0% |
| Interquartile 25% (IQ1) | 31.2% | 18.7% |
| Interquartile 75% (IQ3) | 44.7% | 27.6% |
| Interquartile Range (IQR) | 13.4% | 8.8% |
| Standard Deviation (Sample) | 10.3% | 11.6% |
| Standard Deviation (Population) | 10.3% | 11.6% |
Similar Demographics by Disability Age 65 to 74
Demographics Similar to Natives/Alaskans by Disability Age 65 to 74
In terms of disability age 65 to 74, the demographic groups most similar to Natives/Alaskans are Colville (30.5%, a difference of 0.52%), Chickasaw (30.2%, a difference of 0.62%), Creek (30.2%, a difference of 0.63%), Choctaw (30.2%, a difference of 0.66%), and Alaska Native (30.6%, a difference of 0.77%).
| Demographics | Rating | Rank | Disability Age 65 to 74 |
| Dutch West Indians | 0.0 /100 | #325 | Tragic 29.6% |
| Yakama | 0.0 /100 | #326 | Tragic 29.6% |
| Apache | 0.0 /100 | #327 | Tragic 29.7% |
| Hopi | 0.0 /100 | #328 | Tragic 30.0% |
| Choctaw | 0.0 /100 | #329 | Tragic 30.2% |
| Creek | 0.0 /100 | #330 | Tragic 30.2% |
| Chickasaw | 0.0 /100 | #331 | Tragic 30.2% |
| Natives/Alaskans | 0.0 /100 | #332 | Tragic 30.4% |
| Colville | 0.0 /100 | #333 | Tragic 30.5% |
| Alaska Natives | 0.0 /100 | #334 | Tragic 30.6% |
| Cheyenne | 0.0 /100 | #335 | Tragic 31.1% |
| Yuman | 0.0 /100 | #336 | Tragic 31.5% |
| Houma | 0.0 /100 | #337 | Tragic 32.3% |
| Alaskan Athabascans | 0.0 /100 | #338 | Tragic 32.4% |
| Kiowa | 0.0 /100 | #339 | Tragic 32.6% |
Demographics Similar to Basques by Disability Age 65 to 74
In terms of disability age 65 to 74, the demographic groups most similar to Basques are Portuguese (23.5%, a difference of 0.040%), Haitian (23.4%, a difference of 0.24%), Immigrants from Germany (23.4%, a difference of 0.25%), Immigrants from Eastern Africa (23.4%, a difference of 0.27%), and Immigrants from Cuba (23.6%, a difference of 0.27%).
| Demographics | Rating | Rank | Disability Age 65 to 74 |
| Immigrants | Sierra Leone | 45.8 /100 | #179 | Average 23.4% |
| Scandinavians | 45.6 /100 | #180 | Average 23.4% |
| Assyrians/Chaldeans/Syriacs | 45.3 /100 | #181 | Average 23.4% |
| Irish | 44.4 /100 | #182 | Average 23.4% |
| Immigrants | Eastern Africa | 42.8 /100 | #183 | Average 23.4% |
| Immigrants | Germany | 42.5 /100 | #184 | Average 23.4% |
| Haitians | 42.4 /100 | #185 | Average 23.4% |
| Basques | 38.4 /100 | #186 | Fair 23.5% |
| Portuguese | 37.8 /100 | #187 | Fair 23.5% |
| Immigrants | Cuba | 34.0 /100 | #188 | Fair 23.6% |
| Scottish | 33.1 /100 | #189 | Fair 23.6% |
| Immigrants | Guyana | 31.2 /100 | #190 | Fair 23.6% |
| Immigrants | Bangladesh | 30.2 /100 | #191 | Fair 23.6% |
| Ecuadorians | 29.7 /100 | #192 | Fair 23.6% |
| English | 28.5 /100 | #193 | Fair 23.6% |