Native Hawaiian vs Immigrants from Burma/Myanmar Median Earnings
COMPARE
Native Hawaiian
Immigrants from Burma/Myanmar
Median Earnings
Median Earnings Comparison
Native Hawaiians
Immigrants from Burma/Myanmar
$45,027
MEDIAN EARNINGS
12.2/ 100
METRIC RATING
227th/ 347
METRIC RANK
$43,998
MEDIAN EARNINGS
3.2/ 100
METRIC RATING
245th/ 347
METRIC RANK
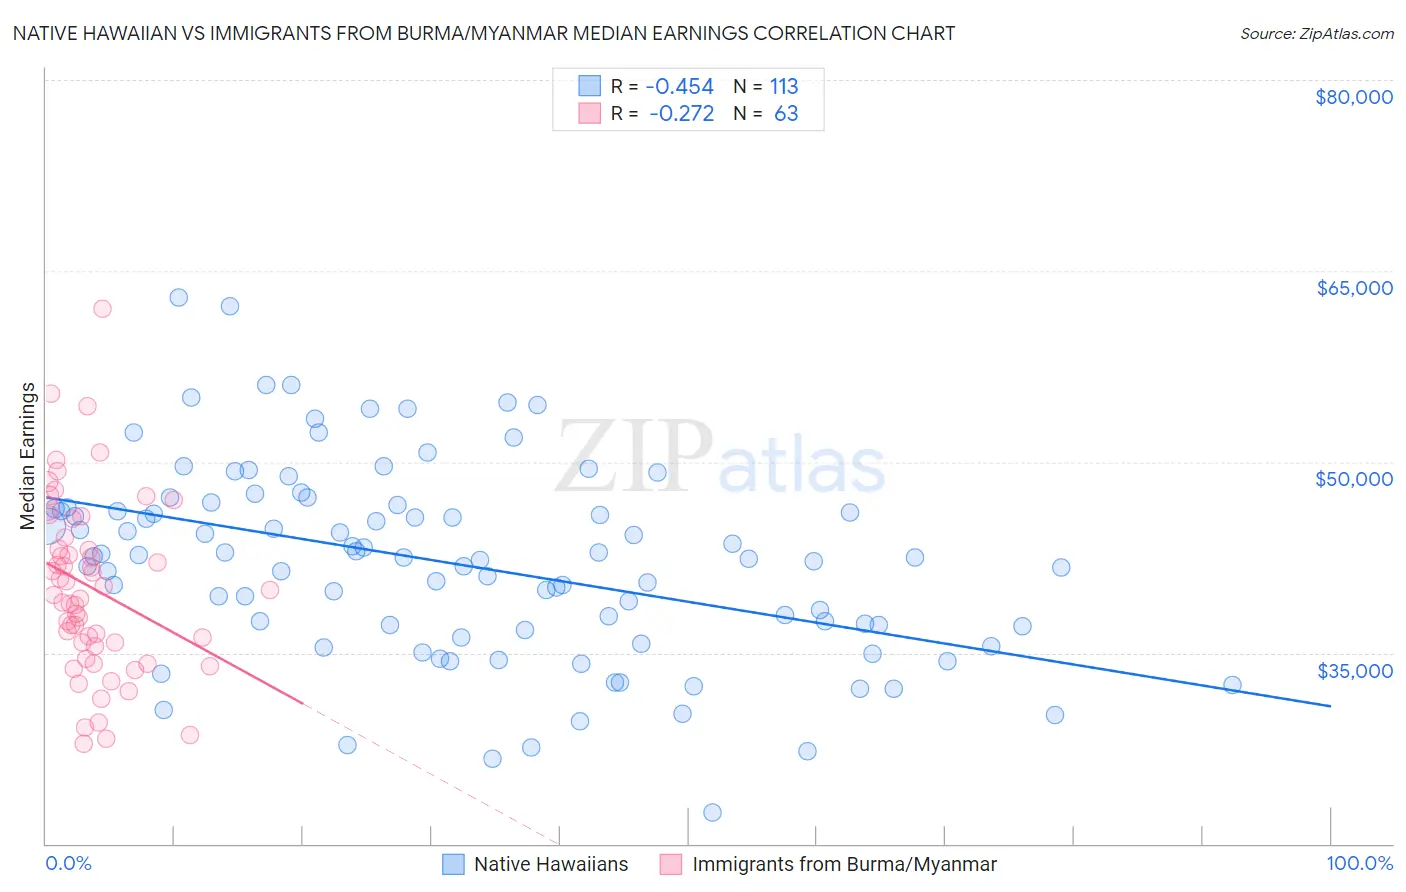
Native Hawaiian vs Immigrants from Burma/Myanmar Median Earnings Correlation Chart
The statistical analysis conducted on geographies consisting of 332,103,903 people shows a moderate negative correlation between the proportion of Native Hawaiians and median earnings in the United States with a correlation coefficient (R) of -0.454 and weighted average of $45,027. Similarly, the statistical analysis conducted on geographies consisting of 172,362,577 people shows a weak negative correlation between the proportion of Immigrants from Burma/Myanmar and median earnings in the United States with a correlation coefficient (R) of -0.272 and weighted average of $43,998, a difference of 2.3%.
Median Earnings Correlation Summary
| Measurement | Native Hawaiian | Immigrants from Burma/Myanmar |
| Minimum | $22,468 | $27,898 |
| Maximum | $62,910 | $62,054 |
| Range | $40,442 | $34,156 |
| Mean | $42,021 | $40,087 |
| Median | $42,485 | $39,569 |
| Interquartile 25% (IQ1) | $36,941 | $35,543 |
| Interquartile 75% (IQ3) | $46,349 | $44,022 |
| Interquartile Range (IQR) | $9,407 | $8,479 |
| Standard Deviation (Sample) | $7,647 | $6,933 |
| Standard Deviation (Population) | $7,613 | $6,878 |
Demographics Similar to Native Hawaiians and Immigrants from Burma/Myanmar by Median Earnings
In terms of median earnings, the demographic groups most similar to Native Hawaiians are Immigrants from Nigeria ($45,030, a difference of 0.010%), Immigrants from Iraq ($44,988, a difference of 0.090%), Scotch-Irish ($44,924, a difference of 0.23%), Immigrants from Western Africa ($44,893, a difference of 0.30%), and Japanese ($44,825, a difference of 0.45%). Similarly, the demographic groups most similar to Immigrants from Burma/Myanmar are Immigrants from West Indies ($43,989, a difference of 0.020%), Subsaharan African ($44,118, a difference of 0.27%), Nonimmigrants ($44,117, a difference of 0.27%), Immigrants from Venezuela ($44,163, a difference of 0.37%), and Samoan ($44,206, a difference of 0.47%).
| Demographics | Rating | Rank | Median Earnings |
| Immigrants | Nigeria | 12.2 /100 | #226 | Poor $45,030 |
| Native Hawaiians | 12.2 /100 | #227 | Poor $45,027 |
| Immigrants | Iraq | 11.6 /100 | #228 | Poor $44,988 |
| Scotch-Irish | 10.7 /100 | #229 | Poor $44,924 |
| Immigrants | Western Africa | 10.3 /100 | #230 | Poor $44,893 |
| Japanese | 9.5 /100 | #231 | Tragic $44,825 |
| Delaware | 9.0 /100 | #232 | Tragic $44,783 |
| Immigrants | Sudan | 8.8 /100 | #233 | Tragic $44,767 |
| Cape Verdeans | 7.5 /100 | #234 | Tragic $44,640 |
| Venezuelans | 6.9 /100 | #235 | Tragic $44,580 |
| British West Indians | 6.7 /100 | #236 | Tragic $44,552 |
| Immigrants | Ecuador | 5.9 /100 | #237 | Tragic $44,462 |
| Sudanese | 5.6 /100 | #238 | Tragic $44,419 |
| Senegalese | 5.3 /100 | #239 | Tragic $44,373 |
| Aleuts | 4.4 /100 | #240 | Tragic $44,241 |
| Samoans | 4.2 /100 | #241 | Tragic $44,206 |
| Immigrants | Venezuela | 4.0 /100 | #242 | Tragic $44,163 |
| Sub-Saharan Africans | 3.7 /100 | #243 | Tragic $44,118 |
| Immigrants | Nonimmigrants | 3.7 /100 | #244 | Tragic $44,117 |
| Immigrants | Burma/Myanmar | 3.2 /100 | #245 | Tragic $43,998 |
| Immigrants | West Indies | 3.1 /100 | #246 | Tragic $43,989 |