Luxembourger vs Immigrants from Burma/Myanmar Median Earnings
COMPARE
Luxembourger
Immigrants from Burma/Myanmar
Median Earnings
Median Earnings Comparison
Luxembourgers
Immigrants from Burma/Myanmar
$47,640
MEDIAN EARNINGS
84.5/ 100
METRIC RATING
149th/ 347
METRIC RANK
$43,998
MEDIAN EARNINGS
3.2/ 100
METRIC RATING
245th/ 347
METRIC RANK
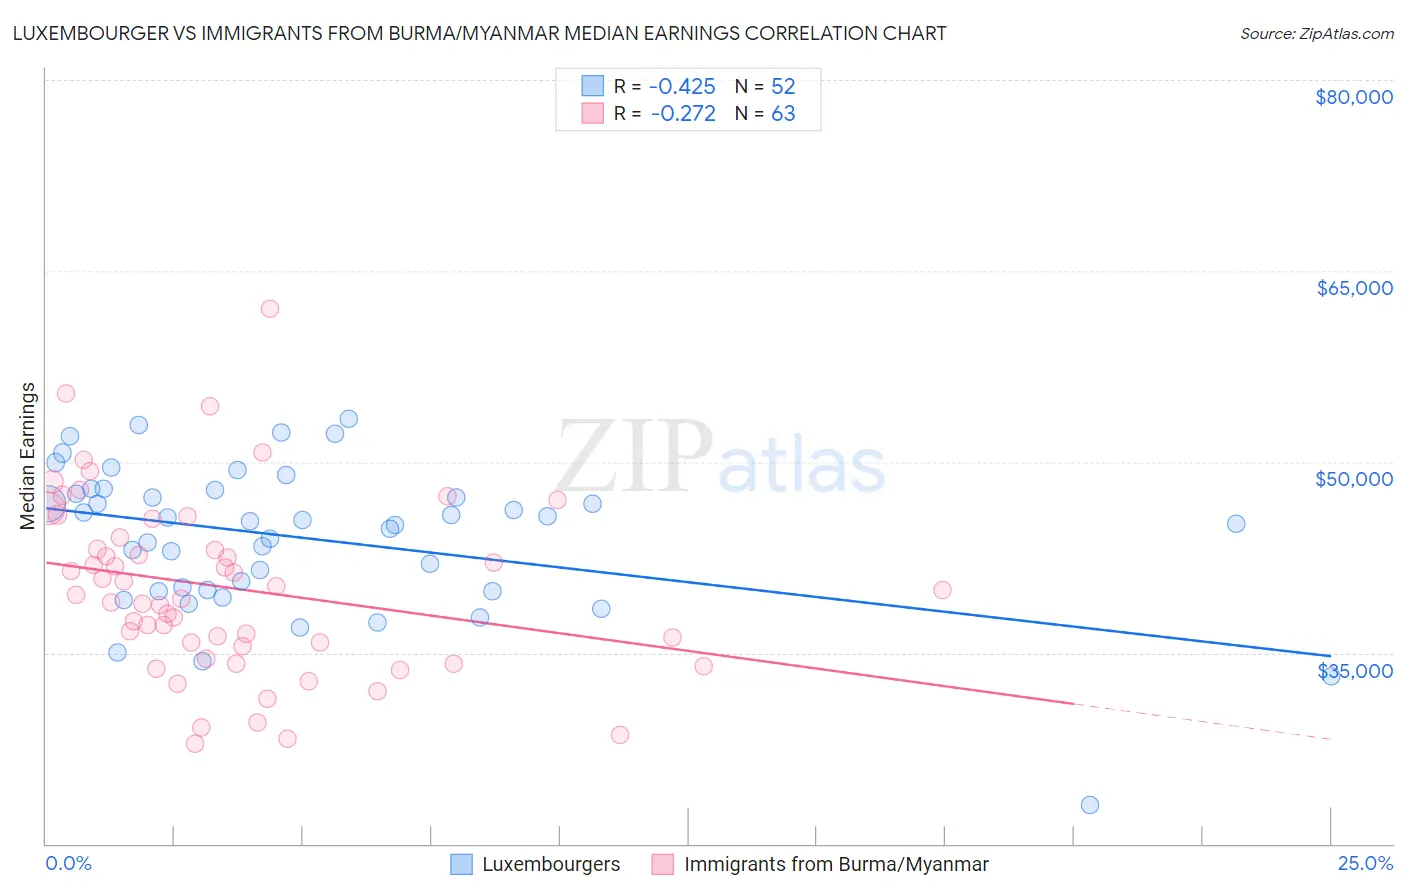
Luxembourger vs Immigrants from Burma/Myanmar Median Earnings Correlation Chart
The statistical analysis conducted on geographies consisting of 144,679,059 people shows a moderate negative correlation between the proportion of Luxembourgers and median earnings in the United States with a correlation coefficient (R) of -0.425 and weighted average of $47,640. Similarly, the statistical analysis conducted on geographies consisting of 172,362,577 people shows a weak negative correlation between the proportion of Immigrants from Burma/Myanmar and median earnings in the United States with a correlation coefficient (R) of -0.272 and weighted average of $43,998, a difference of 8.3%.
Median Earnings Correlation Summary
| Measurement | Luxembourger | Immigrants from Burma/Myanmar |
| Minimum | $23,065 | $27,898 |
| Maximum | $53,418 | $62,054 |
| Range | $30,353 | $34,156 |
| Mean | $43,977 | $40,087 |
| Median | $45,242 | $39,569 |
| Interquartile 25% (IQ1) | $39,899 | $35,543 |
| Interquartile 75% (IQ3) | $47,654 | $44,022 |
| Interquartile Range (IQR) | $7,755 | $8,479 |
| Standard Deviation (Sample) | $5,791 | $6,933 |
| Standard Deviation (Population) | $5,735 | $6,878 |
Similar Demographics by Median Earnings
Demographics Similar to Luxembourgers by Median Earnings
In terms of median earnings, the demographic groups most similar to Luxembourgers are Peruvian ($47,628, a difference of 0.020%), Immigrants from Eritrea ($47,657, a difference of 0.040%), Immigrants from Oceania ($47,617, a difference of 0.050%), Immigrants from South Eastern Asia ($47,671, a difference of 0.060%), and Immigrants from Chile ($47,697, a difference of 0.12%).
| Demographics | Rating | Rank | Median Earnings |
| Ugandans | 88.0 /100 | #142 | Excellent $47,854 |
| Swedes | 88.0 /100 | #143 | Excellent $47,851 |
| Hungarians | 87.1 /100 | #144 | Excellent $47,795 |
| Immigrants | Saudi Arabia | 85.6 /100 | #145 | Excellent $47,704 |
| Immigrants | Chile | 85.5 /100 | #146 | Excellent $47,697 |
| Immigrants | South Eastern Asia | 85.0 /100 | #147 | Excellent $47,671 |
| Immigrants | Eritrea | 84.8 /100 | #148 | Excellent $47,657 |
| Luxembourgers | 84.5 /100 | #149 | Excellent $47,640 |
| Peruvians | 84.2 /100 | #150 | Excellent $47,628 |
| Immigrants | Oceania | 84.1 /100 | #151 | Excellent $47,617 |
| Immigrants | Germany | 83.1 /100 | #152 | Excellent $47,566 |
| Slavs | 81.1 /100 | #153 | Excellent $47,470 |
| Immigrants | Portugal | 77.3 /100 | #154 | Good $47,304 |
| Immigrants | Vietnam | 76.7 /100 | #155 | Good $47,282 |
| Irish | 76.6 /100 | #156 | Good $47,276 |
Demographics Similar to Immigrants from Burma/Myanmar by Median Earnings
In terms of median earnings, the demographic groups most similar to Immigrants from Burma/Myanmar are Immigrants from West Indies ($43,989, a difference of 0.020%), Immigrants from Cabo Verde ($43,963, a difference of 0.080%), Subsaharan African ($44,118, a difference of 0.27%), Nonimmigrants ($44,117, a difference of 0.27%), and Nepalese ($43,860, a difference of 0.31%).
| Demographics | Rating | Rank | Median Earnings |
| Sudanese | 5.6 /100 | #238 | Tragic $44,419 |
| Senegalese | 5.3 /100 | #239 | Tragic $44,373 |
| Aleuts | 4.4 /100 | #240 | Tragic $44,241 |
| Samoans | 4.2 /100 | #241 | Tragic $44,206 |
| Immigrants | Venezuela | 4.0 /100 | #242 | Tragic $44,163 |
| Sub-Saharan Africans | 3.7 /100 | #243 | Tragic $44,118 |
| Immigrants | Nonimmigrants | 3.7 /100 | #244 | Tragic $44,117 |
| Immigrants | Burma/Myanmar | 3.2 /100 | #245 | Tragic $43,998 |
| Immigrants | West Indies | 3.1 /100 | #246 | Tragic $43,989 |
| Immigrants | Cabo Verde | 3.0 /100 | #247 | Tragic $43,963 |
| Nepalese | 2.6 /100 | #248 | Tragic $43,860 |
| Malaysians | 2.6 /100 | #249 | Tragic $43,844 |
| Alaska Natives | 2.3 /100 | #250 | Tragic $43,750 |
| Tsimshian | 2.1 /100 | #251 | Tragic $43,695 |
| Hawaiians | 2.0 /100 | #252 | Tragic $43,673 |