Native Hawaiian vs Immigrants from Sierra Leone Median Earnings
COMPARE
Native Hawaiian
Immigrants from Sierra Leone
Median Earnings
Median Earnings Comparison
Native Hawaiians
Immigrants from Sierra Leone
$45,027
MEDIAN EARNINGS
12.2/ 100
METRIC RATING
227th/ 347
METRIC RANK
$47,875
MEDIAN EARNINGS
88.3/ 100
METRIC RATING
141st/ 347
METRIC RANK
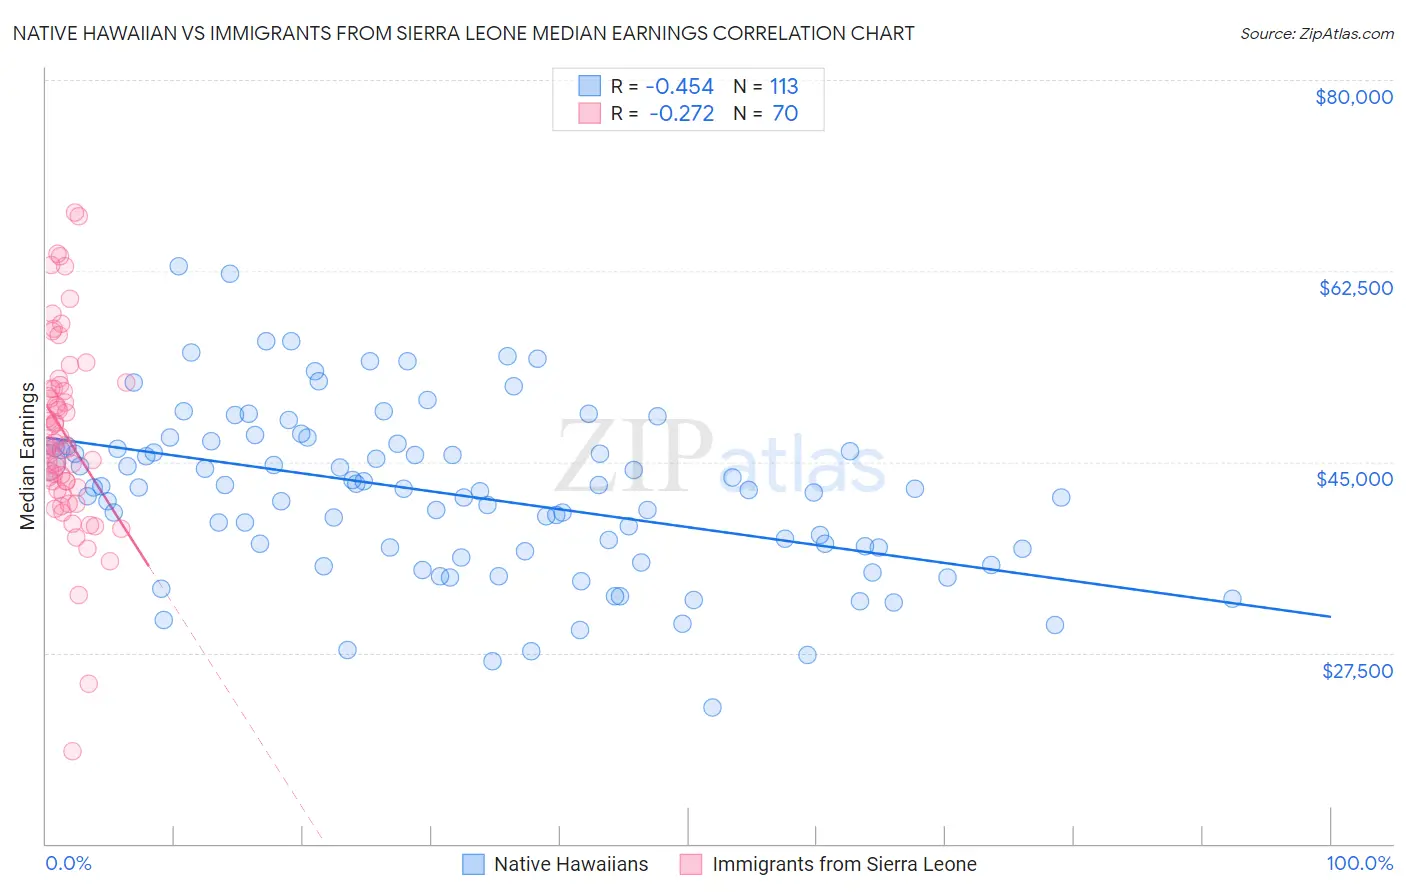
Native Hawaiian vs Immigrants from Sierra Leone Median Earnings Correlation Chart
The statistical analysis conducted on geographies consisting of 332,103,903 people shows a moderate negative correlation between the proportion of Native Hawaiians and median earnings in the United States with a correlation coefficient (R) of -0.454 and weighted average of $45,027. Similarly, the statistical analysis conducted on geographies consisting of 101,648,548 people shows a weak negative correlation between the proportion of Immigrants from Sierra Leone and median earnings in the United States with a correlation coefficient (R) of -0.272 and weighted average of $47,875, a difference of 6.3%.
Median Earnings Correlation Summary
| Measurement | Native Hawaiian | Immigrants from Sierra Leone |
| Minimum | $22,468 | $18,466 |
| Maximum | $62,910 | $67,883 |
| Range | $40,442 | $49,417 |
| Mean | $42,021 | $47,536 |
| Median | $42,485 | $46,582 |
| Interquartile 25% (IQ1) | $36,941 | $42,603 |
| Interquartile 75% (IQ3) | $46,349 | $51,717 |
| Interquartile Range (IQR) | $9,407 | $9,114 |
| Standard Deviation (Sample) | $7,647 | $8,851 |
| Standard Deviation (Population) | $7,613 | $8,787 |
Similar Demographics by Median Earnings
Demographics Similar to Native Hawaiians by Median Earnings
In terms of median earnings, the demographic groups most similar to Native Hawaiians are Immigrants from Nigeria ($45,030, a difference of 0.010%), Immigrants from Iraq ($44,988, a difference of 0.090%), Immigrants from Cambodia ($45,090, a difference of 0.14%), West Indian ($45,132, a difference of 0.23%), and Scotch-Irish ($44,924, a difference of 0.23%).
| Demographics | Rating | Rank | Median Earnings |
| Ecuadorians | 15.3 /100 | #220 | Poor $45,214 |
| Immigrants | Guyana | 15.1 /100 | #221 | Poor $45,204 |
| Immigrants | Panama | 15.0 /100 | #222 | Poor $45,198 |
| Whites/Caucasians | 15.0 /100 | #223 | Poor $45,197 |
| West Indians | 13.9 /100 | #224 | Poor $45,132 |
| Immigrants | Cambodia | 13.2 /100 | #225 | Poor $45,090 |
| Immigrants | Nigeria | 12.2 /100 | #226 | Poor $45,030 |
| Native Hawaiians | 12.2 /100 | #227 | Poor $45,027 |
| Immigrants | Iraq | 11.6 /100 | #228 | Poor $44,988 |
| Scotch-Irish | 10.7 /100 | #229 | Poor $44,924 |
| Immigrants | Western Africa | 10.3 /100 | #230 | Poor $44,893 |
| Japanese | 9.5 /100 | #231 | Tragic $44,825 |
| Delaware | 9.0 /100 | #232 | Tragic $44,783 |
| Immigrants | Sudan | 8.8 /100 | #233 | Tragic $44,767 |
| Cape Verdeans | 7.5 /100 | #234 | Tragic $44,640 |
Demographics Similar to Immigrants from Sierra Leone by Median Earnings
In terms of median earnings, the demographic groups most similar to Immigrants from Sierra Leone are Ugandan ($47,854, a difference of 0.040%), Swedish ($47,851, a difference of 0.050%), Taiwanese ($47,902, a difference of 0.060%), European ($47,915, a difference of 0.080%), and Canadian ($47,911, a difference of 0.080%).
| Demographics | Rating | Rank | Median Earnings |
| Sri Lankans | 90.5 /100 | #134 | Exceptional $48,040 |
| Portuguese | 90.4 /100 | #135 | Exceptional $48,032 |
| Slovenes | 90.0 /100 | #136 | Excellent $47,995 |
| Immigrants | Nepal | 89.0 /100 | #137 | Excellent $47,925 |
| Europeans | 88.9 /100 | #138 | Excellent $47,915 |
| Canadians | 88.8 /100 | #139 | Excellent $47,911 |
| Taiwanese | 88.7 /100 | #140 | Excellent $47,902 |
| Immigrants | Sierra Leone | 88.3 /100 | #141 | Excellent $47,875 |
| Ugandans | 88.0 /100 | #142 | Excellent $47,854 |
| Swedes | 88.0 /100 | #143 | Excellent $47,851 |
| Hungarians | 87.1 /100 | #144 | Excellent $47,795 |
| Immigrants | Saudi Arabia | 85.6 /100 | #145 | Excellent $47,704 |
| Immigrants | Chile | 85.5 /100 | #146 | Excellent $47,697 |
| Immigrants | South Eastern Asia | 85.0 /100 | #147 | Excellent $47,671 |
| Immigrants | Eritrea | 84.8 /100 | #148 | Excellent $47,657 |