Native Hawaiian vs U.S. Virgin Islander Median Earnings
COMPARE
Native Hawaiian
U.S. Virgin Islander
Median Earnings
Median Earnings Comparison
Native Hawaiians
U.S. Virgin Islanders
$45,027
MEDIAN EARNINGS
12.2/ 100
METRIC RATING
227th/ 347
METRIC RANK
$41,448
MEDIAN EARNINGS
0.1/ 100
METRIC RATING
292nd/ 347
METRIC RANK
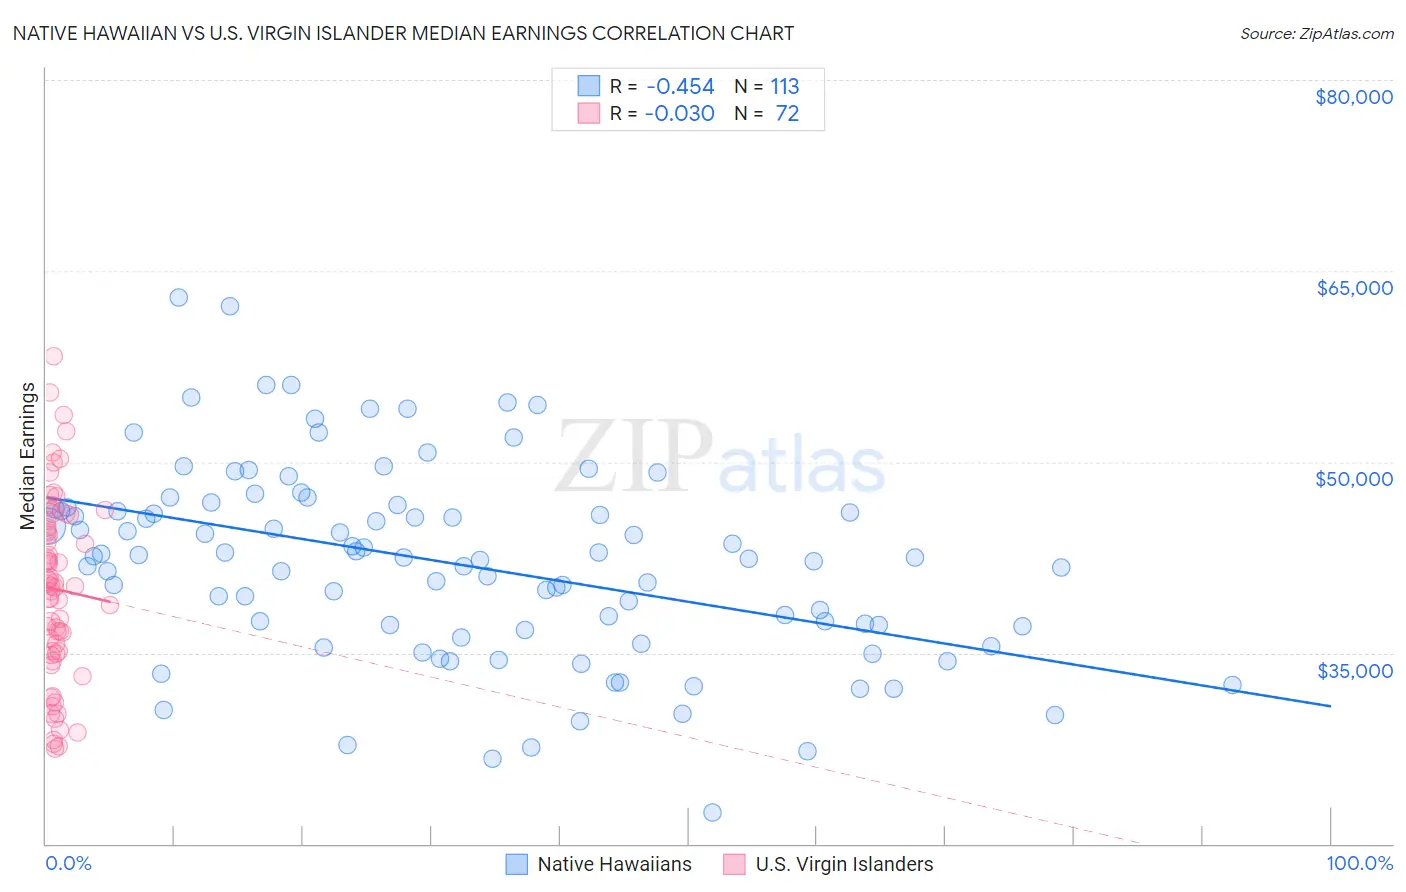
Native Hawaiian vs U.S. Virgin Islander Median Earnings Correlation Chart
The statistical analysis conducted on geographies consisting of 332,103,903 people shows a moderate negative correlation between the proportion of Native Hawaiians and median earnings in the United States with a correlation coefficient (R) of -0.454 and weighted average of $45,027. Similarly, the statistical analysis conducted on geographies consisting of 87,526,165 people shows no correlation between the proportion of U.S. Virgin Islanders and median earnings in the United States with a correlation coefficient (R) of -0.030 and weighted average of $41,448, a difference of 8.6%.
Median Earnings Correlation Summary
| Measurement | Native Hawaiian | U.S. Virgin Islander |
| Minimum | $22,468 | $27,466 |
| Maximum | $62,910 | $58,251 |
| Range | $40,442 | $30,785 |
| Mean | $42,021 | $39,999 |
| Median | $42,485 | $40,206 |
| Interquartile 25% (IQ1) | $36,941 | $35,022 |
| Interquartile 75% (IQ3) | $46,349 | $45,141 |
| Interquartile Range (IQR) | $9,407 | $10,119 |
| Standard Deviation (Sample) | $7,647 | $7,165 |
| Standard Deviation (Population) | $7,613 | $7,115 |
Similar Demographics by Median Earnings
Demographics Similar to Native Hawaiians by Median Earnings
In terms of median earnings, the demographic groups most similar to Native Hawaiians are Immigrants from Nigeria ($45,030, a difference of 0.010%), Immigrants from Iraq ($44,988, a difference of 0.090%), Immigrants from Cambodia ($45,090, a difference of 0.14%), West Indian ($45,132, a difference of 0.23%), and Scotch-Irish ($44,924, a difference of 0.23%).
| Demographics | Rating | Rank | Median Earnings |
| Ecuadorians | 15.3 /100 | #220 | Poor $45,214 |
| Immigrants | Guyana | 15.1 /100 | #221 | Poor $45,204 |
| Immigrants | Panama | 15.0 /100 | #222 | Poor $45,198 |
| Whites/Caucasians | 15.0 /100 | #223 | Poor $45,197 |
| West Indians | 13.9 /100 | #224 | Poor $45,132 |
| Immigrants | Cambodia | 13.2 /100 | #225 | Poor $45,090 |
| Immigrants | Nigeria | 12.2 /100 | #226 | Poor $45,030 |
| Native Hawaiians | 12.2 /100 | #227 | Poor $45,027 |
| Immigrants | Iraq | 11.6 /100 | #228 | Poor $44,988 |
| Scotch-Irish | 10.7 /100 | #229 | Poor $44,924 |
| Immigrants | Western Africa | 10.3 /100 | #230 | Poor $44,893 |
| Japanese | 9.5 /100 | #231 | Tragic $44,825 |
| Delaware | 9.0 /100 | #232 | Tragic $44,783 |
| Immigrants | Sudan | 8.8 /100 | #233 | Tragic $44,767 |
| Cape Verdeans | 7.5 /100 | #234 | Tragic $44,640 |
Demographics Similar to U.S. Virgin Islanders by Median Earnings
In terms of median earnings, the demographic groups most similar to U.S. Virgin Islanders are Central American Indian ($41,474, a difference of 0.060%), Paiute ($41,508, a difference of 0.15%), Comanche ($41,519, a difference of 0.17%), Immigrants from Dominican Republic ($41,554, a difference of 0.26%), and Immigrants from Zaire ($41,325, a difference of 0.30%).
| Demographics | Rating | Rank | Median Earnings |
| Immigrants | Nicaragua | 0.1 /100 | #285 | Tragic $41,737 |
| Mexican American Indians | 0.1 /100 | #286 | Tragic $41,719 |
| Indonesians | 0.1 /100 | #287 | Tragic $41,701 |
| Immigrants | Dominican Republic | 0.1 /100 | #288 | Tragic $41,554 |
| Comanche | 0.1 /100 | #289 | Tragic $41,519 |
| Paiute | 0.1 /100 | #290 | Tragic $41,508 |
| Central American Indians | 0.1 /100 | #291 | Tragic $41,474 |
| U.S. Virgin Islanders | 0.1 /100 | #292 | Tragic $41,448 |
| Immigrants | Zaire | 0.1 /100 | #293 | Tragic $41,325 |
| Potawatomi | 0.1 /100 | #294 | Tragic $41,288 |
| Bangladeshis | 0.1 /100 | #295 | Tragic $41,263 |
| Cherokee | 0.1 /100 | #296 | Tragic $41,252 |
| Guatemalans | 0.1 /100 | #297 | Tragic $41,205 |
| Immigrants | Micronesia | 0.1 /100 | #298 | Tragic $41,133 |
| Immigrants | Caribbean | 0.1 /100 | #299 | Tragic $41,119 |