African vs Immigrants from Burma/Myanmar Median Earnings
COMPARE
African
Immigrants from Burma/Myanmar
Median Earnings
Median Earnings Comparison
Africans
Immigrants from Burma/Myanmar
$41,955
MEDIAN EARNINGS
0.2/ 100
METRIC RATING
282nd/ 347
METRIC RANK
$43,998
MEDIAN EARNINGS
3.2/ 100
METRIC RATING
245th/ 347
METRIC RANK
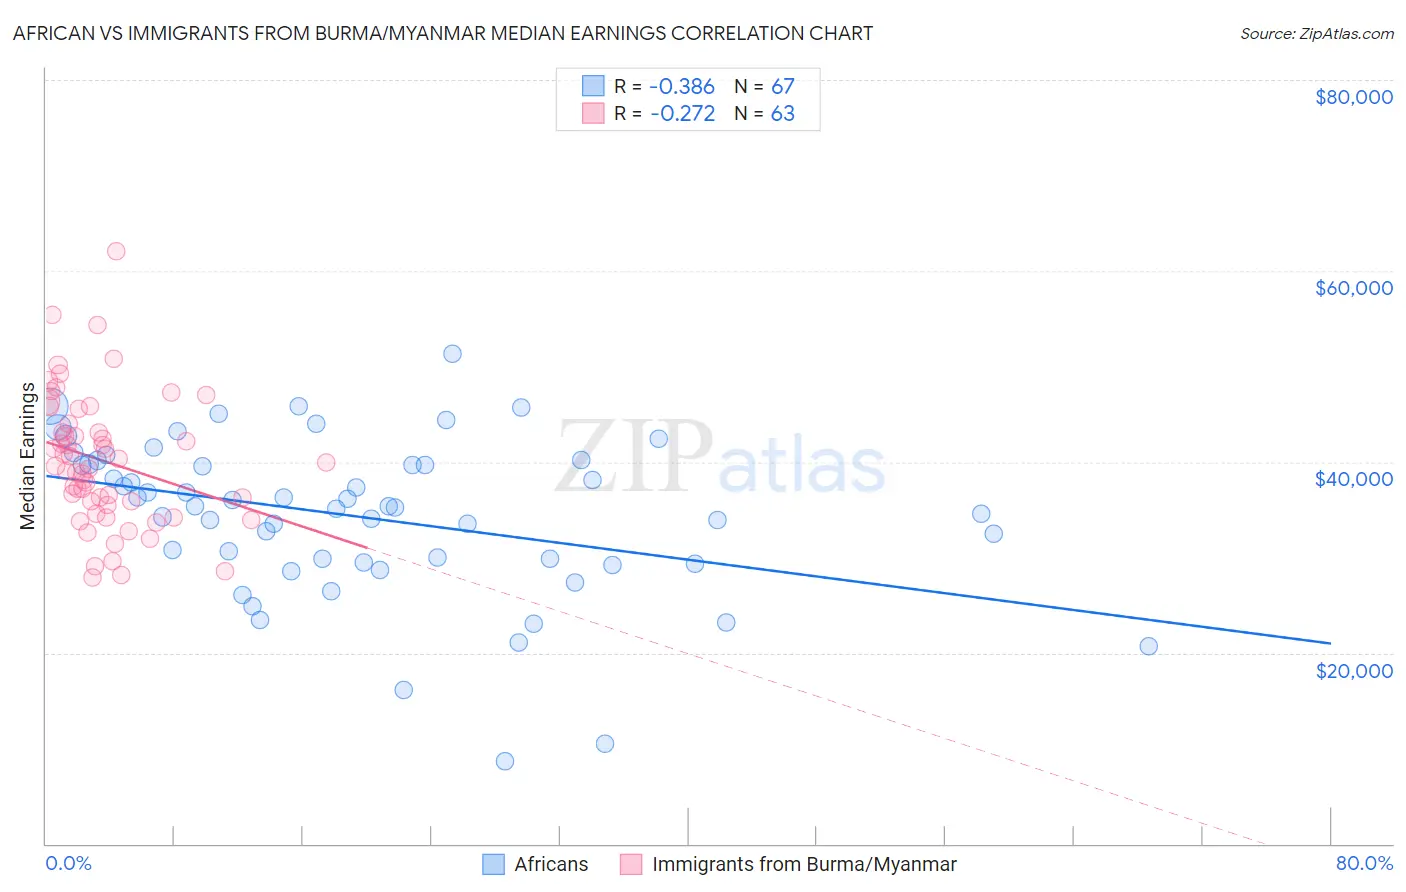
African vs Immigrants from Burma/Myanmar Median Earnings Correlation Chart
The statistical analysis conducted on geographies consisting of 470,066,359 people shows a mild negative correlation between the proportion of Africans and median earnings in the United States with a correlation coefficient (R) of -0.386 and weighted average of $41,955. Similarly, the statistical analysis conducted on geographies consisting of 172,362,577 people shows a weak negative correlation between the proportion of Immigrants from Burma/Myanmar and median earnings in the United States with a correlation coefficient (R) of -0.272 and weighted average of $43,998, a difference of 4.9%.
Median Earnings Correlation Summary
| Measurement | African | Immigrants from Burma/Myanmar |
| Minimum | $8,672 | $27,898 |
| Maximum | $51,324 | $62,054 |
| Range | $42,652 | $34,156 |
| Mean | $34,249 | $40,087 |
| Median | $35,314 | $39,569 |
| Interquartile 25% (IQ1) | $29,519 | $35,543 |
| Interquartile 75% (IQ3) | $39,743 | $44,022 |
| Interquartile Range (IQR) | $10,224 | $8,479 |
| Standard Deviation (Sample) | $8,278 | $6,933 |
| Standard Deviation (Population) | $8,216 | $6,878 |
Similar Demographics by Median Earnings
Demographics Similar to Africans by Median Earnings
In terms of median earnings, the demographic groups most similar to Africans are Marshallese ($41,969, a difference of 0.030%), Dominican ($41,864, a difference of 0.22%), Blackfeet ($41,822, a difference of 0.32%), Hmong ($42,111, a difference of 0.37%), and Colville ($42,151, a difference of 0.47%).
| Demographics | Rating | Rank | Median Earnings |
| Immigrants | Belize | 0.3 /100 | #275 | Tragic $42,339 |
| Spanish Americans | 0.3 /100 | #276 | Tragic $42,316 |
| Central Americans | 0.3 /100 | #277 | Tragic $42,280 |
| Cajuns | 0.3 /100 | #278 | Tragic $42,189 |
| Colville | 0.2 /100 | #279 | Tragic $42,151 |
| Hmong | 0.2 /100 | #280 | Tragic $42,111 |
| Marshallese | 0.2 /100 | #281 | Tragic $41,969 |
| Africans | 0.2 /100 | #282 | Tragic $41,955 |
| Dominicans | 0.2 /100 | #283 | Tragic $41,864 |
| Blackfeet | 0.2 /100 | #284 | Tragic $41,822 |
| Immigrants | Nicaragua | 0.1 /100 | #285 | Tragic $41,737 |
| Mexican American Indians | 0.1 /100 | #286 | Tragic $41,719 |
| Indonesians | 0.1 /100 | #287 | Tragic $41,701 |
| Immigrants | Dominican Republic | 0.1 /100 | #288 | Tragic $41,554 |
| Comanche | 0.1 /100 | #289 | Tragic $41,519 |
Demographics Similar to Immigrants from Burma/Myanmar by Median Earnings
In terms of median earnings, the demographic groups most similar to Immigrants from Burma/Myanmar are Immigrants from West Indies ($43,989, a difference of 0.020%), Immigrants from Cabo Verde ($43,963, a difference of 0.080%), Subsaharan African ($44,118, a difference of 0.27%), Nonimmigrants ($44,117, a difference of 0.27%), and Nepalese ($43,860, a difference of 0.31%).
| Demographics | Rating | Rank | Median Earnings |
| Sudanese | 5.6 /100 | #238 | Tragic $44,419 |
| Senegalese | 5.3 /100 | #239 | Tragic $44,373 |
| Aleuts | 4.4 /100 | #240 | Tragic $44,241 |
| Samoans | 4.2 /100 | #241 | Tragic $44,206 |
| Immigrants | Venezuela | 4.0 /100 | #242 | Tragic $44,163 |
| Sub-Saharan Africans | 3.7 /100 | #243 | Tragic $44,118 |
| Immigrants | Nonimmigrants | 3.7 /100 | #244 | Tragic $44,117 |
| Immigrants | Burma/Myanmar | 3.2 /100 | #245 | Tragic $43,998 |
| Immigrants | West Indies | 3.1 /100 | #246 | Tragic $43,989 |
| Immigrants | Cabo Verde | 3.0 /100 | #247 | Tragic $43,963 |
| Nepalese | 2.6 /100 | #248 | Tragic $43,860 |
| Malaysians | 2.6 /100 | #249 | Tragic $43,844 |
| Alaska Natives | 2.3 /100 | #250 | Tragic $43,750 |
| Tsimshian | 2.1 /100 | #251 | Tragic $43,695 |
| Hawaiians | 2.0 /100 | #252 | Tragic $43,673 |