Immigrants from Australia vs Immigrants from Burma/Myanmar Median Earnings
COMPARE
Immigrants from Australia
Immigrants from Burma/Myanmar
Median Earnings
Median Earnings Comparison
Immigrants from Australia
Immigrants from Burma/Myanmar
$56,305
MEDIAN EARNINGS
100.0/ 100
METRIC RATING
14th/ 347
METRIC RANK
$43,998
MEDIAN EARNINGS
3.2/ 100
METRIC RATING
245th/ 347
METRIC RANK
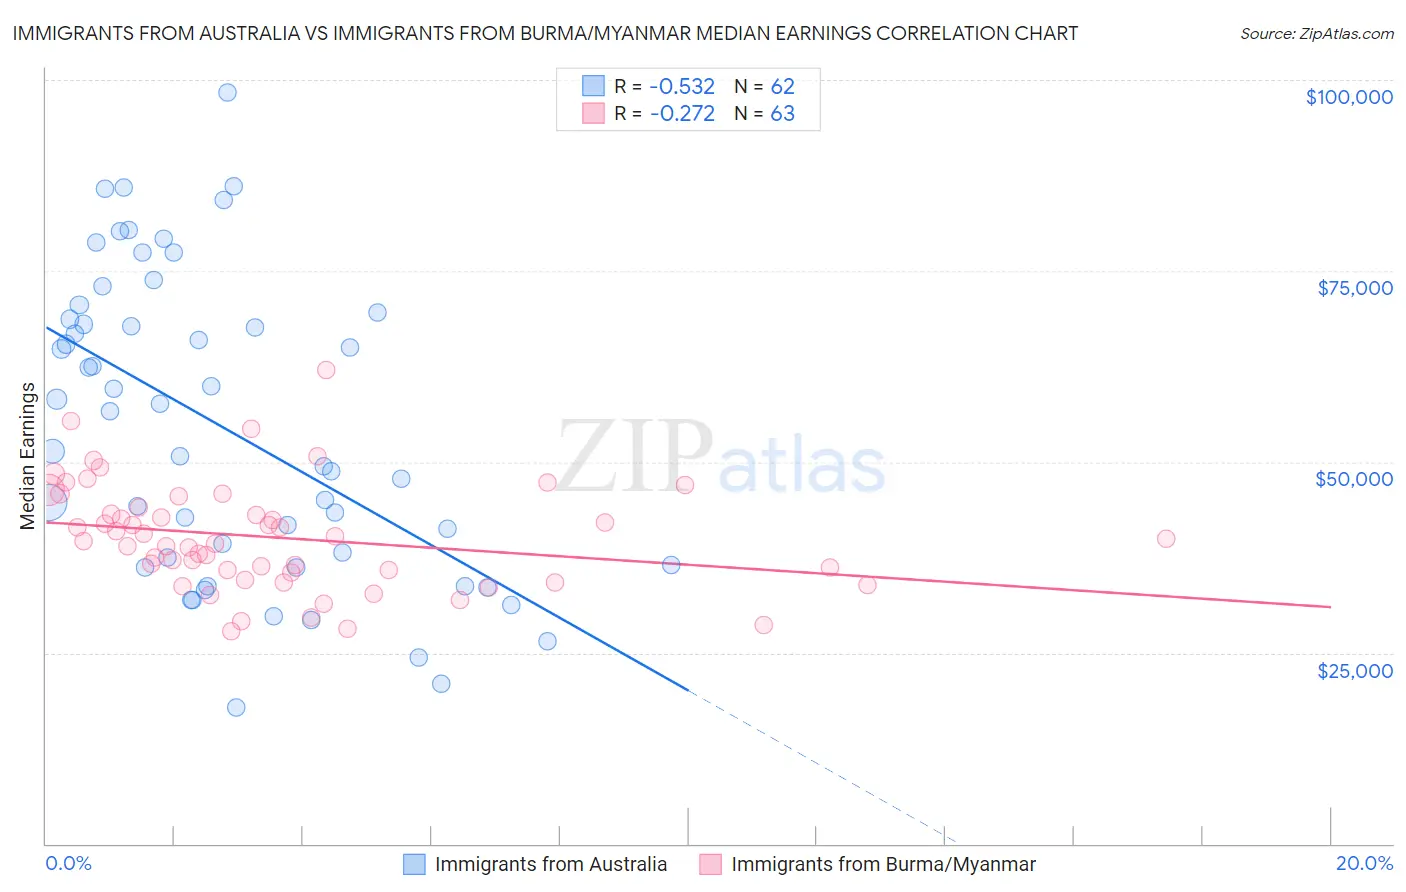
Immigrants from Australia vs Immigrants from Burma/Myanmar Median Earnings Correlation Chart
The statistical analysis conducted on geographies consisting of 227,197,451 people shows a substantial negative correlation between the proportion of Immigrants from Australia and median earnings in the United States with a correlation coefficient (R) of -0.532 and weighted average of $56,305. Similarly, the statistical analysis conducted on geographies consisting of 172,362,577 people shows a weak negative correlation between the proportion of Immigrants from Burma/Myanmar and median earnings in the United States with a correlation coefficient (R) of -0.272 and weighted average of $43,998, a difference of 28.0%.
Median Earnings Correlation Summary
| Measurement | Immigrants from Australia | Immigrants from Burma/Myanmar |
| Minimum | $17,795 | $27,898 |
| Maximum | $98,400 | $62,054 |
| Range | $80,605 | $34,156 |
| Mean | $54,359 | $40,087 |
| Median | $54,001 | $39,569 |
| Interquartile 25% (IQ1) | $36,563 | $35,543 |
| Interquartile 75% (IQ3) | $68,667 | $44,022 |
| Interquartile Range (IQR) | $32,104 | $8,479 |
| Standard Deviation (Sample) | $19,682 | $6,933 |
| Standard Deviation (Population) | $19,523 | $6,878 |
Similar Demographics by Median Earnings
Demographics Similar to Immigrants from Australia by Median Earnings
In terms of median earnings, the demographic groups most similar to Immigrants from Australia are Indian (Asian) ($56,253, a difference of 0.090%), Immigrants from Eastern Asia ($56,183, a difference of 0.22%), Immigrants from China ($56,638, a difference of 0.59%), Immigrants from Ireland ($56,854, a difference of 0.97%), and Immigrants from Israel ($57,034, a difference of 1.3%).
| Demographics | Rating | Rank | Median Earnings |
| Iranians | 100.0 /100 | #7 | Exceptional $58,474 |
| Immigrants | Iran | 100.0 /100 | #8 | Exceptional $57,612 |
| Okinawans | 100.0 /100 | #9 | Exceptional $57,550 |
| Immigrants | South Central Asia | 100.0 /100 | #10 | Exceptional $57,114 |
| Immigrants | Israel | 100.0 /100 | #11 | Exceptional $57,034 |
| Immigrants | Ireland | 100.0 /100 | #12 | Exceptional $56,854 |
| Immigrants | China | 100.0 /100 | #13 | Exceptional $56,638 |
| Immigrants | Australia | 100.0 /100 | #14 | Exceptional $56,305 |
| Indians (Asian) | 100.0 /100 | #15 | Exceptional $56,253 |
| Immigrants | Eastern Asia | 100.0 /100 | #16 | Exceptional $56,183 |
| Eastern Europeans | 100.0 /100 | #17 | Exceptional $55,084 |
| Immigrants | Japan | 100.0 /100 | #18 | Exceptional $54,938 |
| Immigrants | Belgium | 100.0 /100 | #19 | Exceptional $54,679 |
| Cypriots | 100.0 /100 | #20 | Exceptional $54,589 |
| Burmese | 100.0 /100 | #21 | Exceptional $54,559 |
Demographics Similar to Immigrants from Burma/Myanmar by Median Earnings
In terms of median earnings, the demographic groups most similar to Immigrants from Burma/Myanmar are Immigrants from West Indies ($43,989, a difference of 0.020%), Immigrants from Cabo Verde ($43,963, a difference of 0.080%), Subsaharan African ($44,118, a difference of 0.27%), Nonimmigrants ($44,117, a difference of 0.27%), and Nepalese ($43,860, a difference of 0.31%).
| Demographics | Rating | Rank | Median Earnings |
| Sudanese | 5.6 /100 | #238 | Tragic $44,419 |
| Senegalese | 5.3 /100 | #239 | Tragic $44,373 |
| Aleuts | 4.4 /100 | #240 | Tragic $44,241 |
| Samoans | 4.2 /100 | #241 | Tragic $44,206 |
| Immigrants | Venezuela | 4.0 /100 | #242 | Tragic $44,163 |
| Sub-Saharan Africans | 3.7 /100 | #243 | Tragic $44,118 |
| Immigrants | Nonimmigrants | 3.7 /100 | #244 | Tragic $44,117 |
| Immigrants | Burma/Myanmar | 3.2 /100 | #245 | Tragic $43,998 |
| Immigrants | West Indies | 3.1 /100 | #246 | Tragic $43,989 |
| Immigrants | Cabo Verde | 3.0 /100 | #247 | Tragic $43,963 |
| Nepalese | 2.6 /100 | #248 | Tragic $43,860 |
| Malaysians | 2.6 /100 | #249 | Tragic $43,844 |
| Alaska Natives | 2.3 /100 | #250 | Tragic $43,750 |
| Tsimshian | 2.1 /100 | #251 | Tragic $43,695 |
| Hawaiians | 2.0 /100 | #252 | Tragic $43,673 |