Native Hawaiian vs Lithuanian Median Earnings
COMPARE
Native Hawaiian
Lithuanian
Median Earnings
Median Earnings Comparison
Native Hawaiians
Lithuanians
$45,027
MEDIAN EARNINGS
12.2/ 100
METRIC RATING
227th/ 347
METRIC RANK
$50,991
MEDIAN EARNINGS
99.8/ 100
METRIC RATING
70th/ 347
METRIC RANK
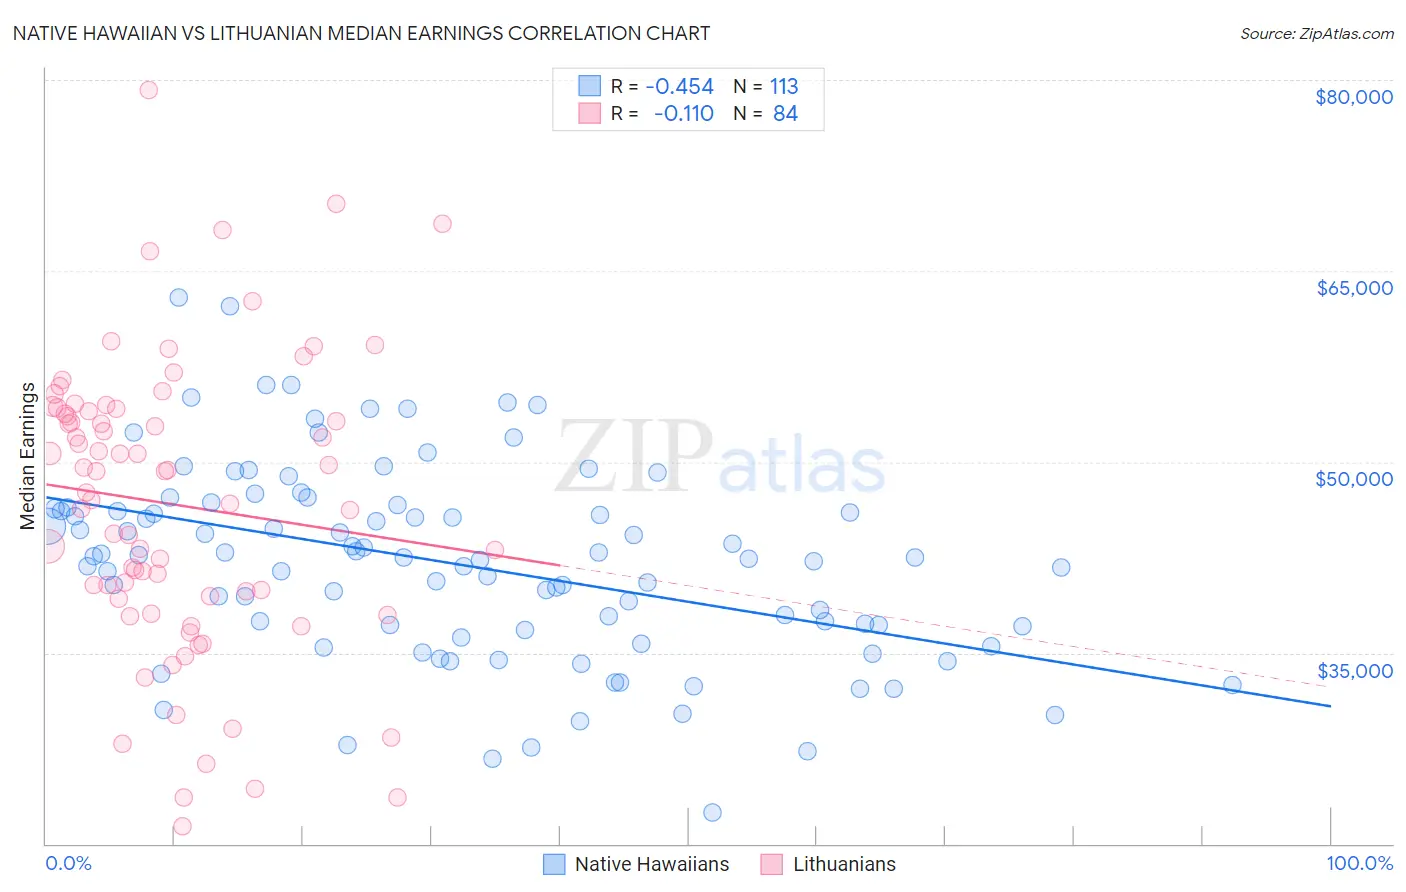
Native Hawaiian vs Lithuanian Median Earnings Correlation Chart
The statistical analysis conducted on geographies consisting of 332,103,903 people shows a moderate negative correlation between the proportion of Native Hawaiians and median earnings in the United States with a correlation coefficient (R) of -0.454 and weighted average of $45,027. Similarly, the statistical analysis conducted on geographies consisting of 421,906,288 people shows a poor negative correlation between the proportion of Lithuanians and median earnings in the United States with a correlation coefficient (R) of -0.110 and weighted average of $50,991, a difference of 13.2%.
Median Earnings Correlation Summary
| Measurement | Native Hawaiian | Lithuanian |
| Minimum | $22,468 | $21,331 |
| Maximum | $62,910 | $79,217 |
| Range | $40,442 | $57,886 |
| Mean | $42,021 | $46,654 |
| Median | $42,485 | $48,402 |
| Interquartile 25% (IQ1) | $36,941 | $39,359 |
| Interquartile 75% (IQ3) | $46,349 | $54,080 |
| Interquartile Range (IQR) | $9,407 | $14,721 |
| Standard Deviation (Sample) | $7,647 | $11,467 |
| Standard Deviation (Population) | $7,613 | $11,398 |
Similar Demographics by Median Earnings
Demographics Similar to Native Hawaiians by Median Earnings
In terms of median earnings, the demographic groups most similar to Native Hawaiians are Immigrants from Nigeria ($45,030, a difference of 0.010%), Immigrants from Iraq ($44,988, a difference of 0.090%), Immigrants from Cambodia ($45,090, a difference of 0.14%), West Indian ($45,132, a difference of 0.23%), and Scotch-Irish ($44,924, a difference of 0.23%).
| Demographics | Rating | Rank | Median Earnings |
| Ecuadorians | 15.3 /100 | #220 | Poor $45,214 |
| Immigrants | Guyana | 15.1 /100 | #221 | Poor $45,204 |
| Immigrants | Panama | 15.0 /100 | #222 | Poor $45,198 |
| Whites/Caucasians | 15.0 /100 | #223 | Poor $45,197 |
| West Indians | 13.9 /100 | #224 | Poor $45,132 |
| Immigrants | Cambodia | 13.2 /100 | #225 | Poor $45,090 |
| Immigrants | Nigeria | 12.2 /100 | #226 | Poor $45,030 |
| Native Hawaiians | 12.2 /100 | #227 | Poor $45,027 |
| Immigrants | Iraq | 11.6 /100 | #228 | Poor $44,988 |
| Scotch-Irish | 10.7 /100 | #229 | Poor $44,924 |
| Immigrants | Western Africa | 10.3 /100 | #230 | Poor $44,893 |
| Japanese | 9.5 /100 | #231 | Tragic $44,825 |
| Delaware | 9.0 /100 | #232 | Tragic $44,783 |
| Immigrants | Sudan | 8.8 /100 | #233 | Tragic $44,767 |
| Cape Verdeans | 7.5 /100 | #234 | Tragic $44,640 |
Demographics Similar to Lithuanians by Median Earnings
In terms of median earnings, the demographic groups most similar to Lithuanians are Immigrants from Ukraine ($50,984, a difference of 0.010%), Mongolian ($51,038, a difference of 0.090%), Paraguayan ($51,068, a difference of 0.15%), Immigrants from Egypt ($50,901, a difference of 0.18%), and Immigrants from Spain ($51,092, a difference of 0.20%).
| Demographics | Rating | Rank | Median Earnings |
| Immigrants | Bulgaria | 99.9 /100 | #63 | Exceptional $51,318 |
| New Zealanders | 99.9 /100 | #64 | Exceptional $51,246 |
| Greeks | 99.9 /100 | #65 | Exceptional $51,164 |
| Afghans | 99.9 /100 | #66 | Exceptional $51,112 |
| Immigrants | Spain | 99.9 /100 | #67 | Exceptional $51,092 |
| Paraguayans | 99.9 /100 | #68 | Exceptional $51,068 |
| Mongolians | 99.8 /100 | #69 | Exceptional $51,038 |
| Lithuanians | 99.8 /100 | #70 | Exceptional $50,991 |
| Immigrants | Ukraine | 99.8 /100 | #71 | Exceptional $50,984 |
| Immigrants | Egypt | 99.8 /100 | #72 | Exceptional $50,901 |
| Immigrants | Netherlands | 99.8 /100 | #73 | Exceptional $50,818 |
| South Africans | 99.8 /100 | #74 | Exceptional $50,752 |
| Immigrants | Scotland | 99.8 /100 | #75 | Exceptional $50,741 |
| Immigrants | Italy | 99.7 /100 | #76 | Exceptional $50,581 |
| Immigrants | Western Europe | 99.7 /100 | #77 | Exceptional $50,549 |