Polish vs Immigrants from Burma/Myanmar Median Earnings
COMPARE
Polish
Immigrants from Burma/Myanmar
Median Earnings
Median Earnings Comparison
Poles
Immigrants from Burma/Myanmar
$48,659
MEDIAN EARNINGS
95.8/ 100
METRIC RATING
119th/ 347
METRIC RANK
$43,998
MEDIAN EARNINGS
3.2/ 100
METRIC RATING
245th/ 347
METRIC RANK
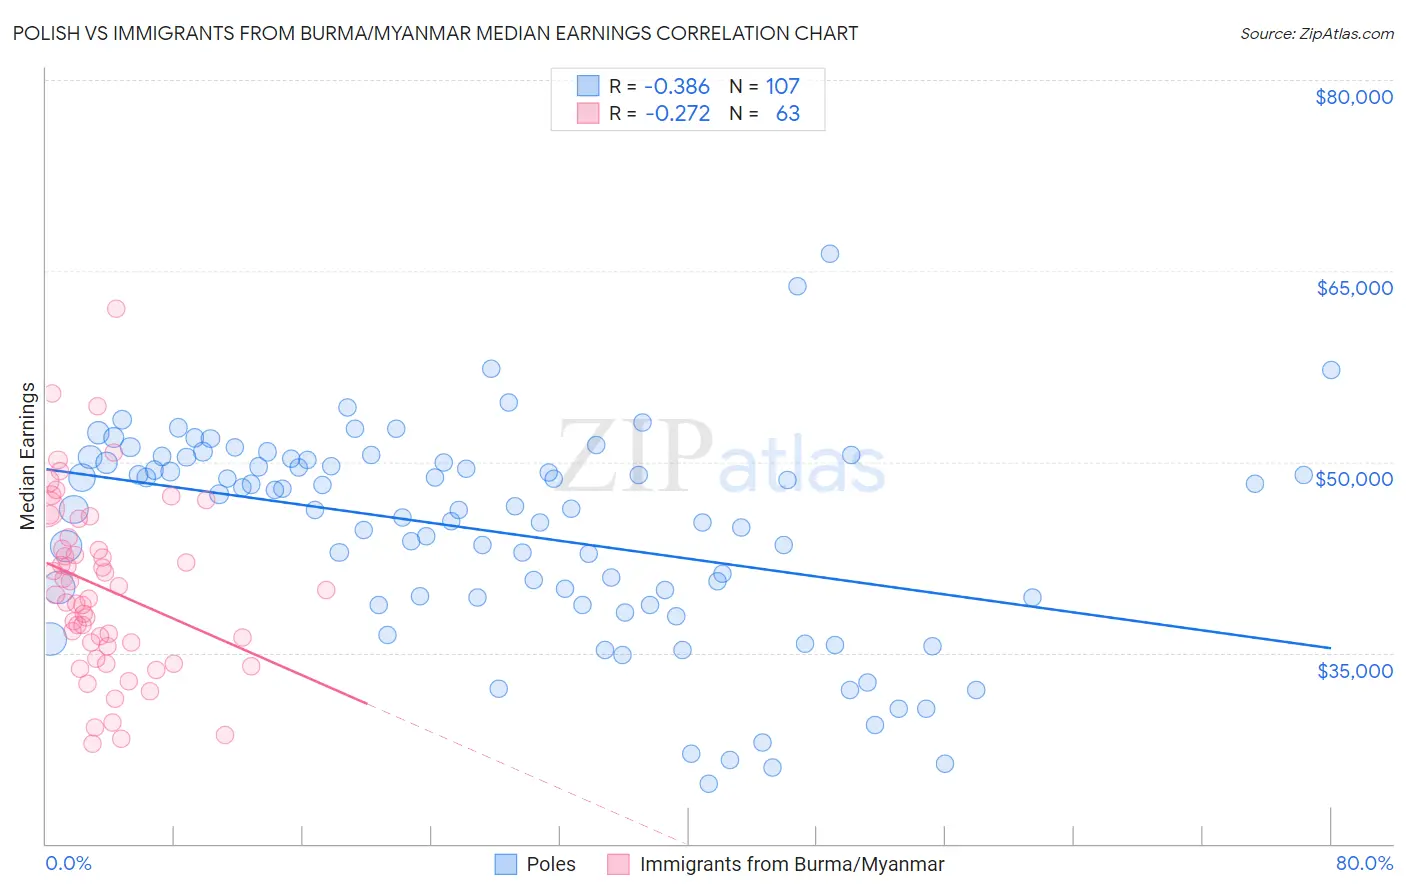
Polish vs Immigrants from Burma/Myanmar Median Earnings Correlation Chart
The statistical analysis conducted on geographies consisting of 560,312,185 people shows a mild negative correlation between the proportion of Poles and median earnings in the United States with a correlation coefficient (R) of -0.386 and weighted average of $48,659. Similarly, the statistical analysis conducted on geographies consisting of 172,362,577 people shows a weak negative correlation between the proportion of Immigrants from Burma/Myanmar and median earnings in the United States with a correlation coefficient (R) of -0.272 and weighted average of $43,998, a difference of 10.6%.
Median Earnings Correlation Summary
| Measurement | Polish | Immigrants from Burma/Myanmar |
| Minimum | $24,750 | $27,898 |
| Maximum | $66,354 | $62,054 |
| Range | $41,604 | $34,156 |
| Mean | $44,491 | $40,087 |
| Median | $46,283 | $39,569 |
| Interquartile 25% (IQ1) | $39,299 | $35,543 |
| Interquartile 75% (IQ3) | $50,191 | $44,022 |
| Interquartile Range (IQR) | $10,892 | $8,479 |
| Standard Deviation (Sample) | $8,192 | $6,933 |
| Standard Deviation (Population) | $8,153 | $6,878 |
Similar Demographics by Median Earnings
Demographics Similar to Poles by Median Earnings
In terms of median earnings, the demographic groups most similar to Poles are Immigrants from Jordan ($48,673, a difference of 0.030%), Serbian ($48,677, a difference of 0.040%), Carpatho Rusyn ($48,617, a difference of 0.080%), Arab ($48,599, a difference of 0.12%), and Korean ($48,727, a difference of 0.14%).
| Demographics | Rating | Rank | Median Earnings |
| Northern Europeans | 96.9 /100 | #112 | Exceptional $48,887 |
| Immigrants | Kuwait | 96.8 /100 | #113 | Exceptional $48,861 |
| Moroccans | 96.7 /100 | #114 | Exceptional $48,838 |
| Chinese | 96.7 /100 | #115 | Exceptional $48,836 |
| Koreans | 96.2 /100 | #116 | Exceptional $48,727 |
| Serbians | 95.9 /100 | #117 | Exceptional $48,677 |
| Immigrants | Jordan | 95.9 /100 | #118 | Exceptional $48,673 |
| Poles | 95.8 /100 | #119 | Exceptional $48,659 |
| Carpatho Rusyns | 95.5 /100 | #120 | Exceptional $48,617 |
| Arabs | 95.4 /100 | #121 | Exceptional $48,599 |
| Chileans | 94.8 /100 | #122 | Exceptional $48,504 |
| Immigrants | Syria | 93.9 /100 | #123 | Exceptional $48,375 |
| Brazilians | 93.7 /100 | #124 | Exceptional $48,356 |
| Immigrants | Fiji | 93.3 /100 | #125 | Exceptional $48,305 |
| Assyrians/Chaldeans/Syriacs | 93.3 /100 | #126 | Exceptional $48,304 |
Demographics Similar to Immigrants from Burma/Myanmar by Median Earnings
In terms of median earnings, the demographic groups most similar to Immigrants from Burma/Myanmar are Immigrants from West Indies ($43,989, a difference of 0.020%), Immigrants from Cabo Verde ($43,963, a difference of 0.080%), Subsaharan African ($44,118, a difference of 0.27%), Nonimmigrants ($44,117, a difference of 0.27%), and Nepalese ($43,860, a difference of 0.31%).
| Demographics | Rating | Rank | Median Earnings |
| Sudanese | 5.6 /100 | #238 | Tragic $44,419 |
| Senegalese | 5.3 /100 | #239 | Tragic $44,373 |
| Aleuts | 4.4 /100 | #240 | Tragic $44,241 |
| Samoans | 4.2 /100 | #241 | Tragic $44,206 |
| Immigrants | Venezuela | 4.0 /100 | #242 | Tragic $44,163 |
| Sub-Saharan Africans | 3.7 /100 | #243 | Tragic $44,118 |
| Immigrants | Nonimmigrants | 3.7 /100 | #244 | Tragic $44,117 |
| Immigrants | Burma/Myanmar | 3.2 /100 | #245 | Tragic $43,998 |
| Immigrants | West Indies | 3.1 /100 | #246 | Tragic $43,989 |
| Immigrants | Cabo Verde | 3.0 /100 | #247 | Tragic $43,963 |
| Nepalese | 2.6 /100 | #248 | Tragic $43,860 |
| Malaysians | 2.6 /100 | #249 | Tragic $43,844 |
| Alaska Natives | 2.3 /100 | #250 | Tragic $43,750 |
| Tsimshian | 2.1 /100 | #251 | Tragic $43,695 |
| Hawaiians | 2.0 /100 | #252 | Tragic $43,673 |