Immigrants from England vs Immigrants from Burma/Myanmar Median Earnings
COMPARE
Immigrants from England
Immigrants from Burma/Myanmar
Median Earnings
Median Earnings Comparison
Immigrants from England
Immigrants from Burma/Myanmar
$49,722
MEDIAN EARNINGS
99.0/ 100
METRIC RATING
95th/ 347
METRIC RANK
$43,998
MEDIAN EARNINGS
3.2/ 100
METRIC RATING
245th/ 347
METRIC RANK
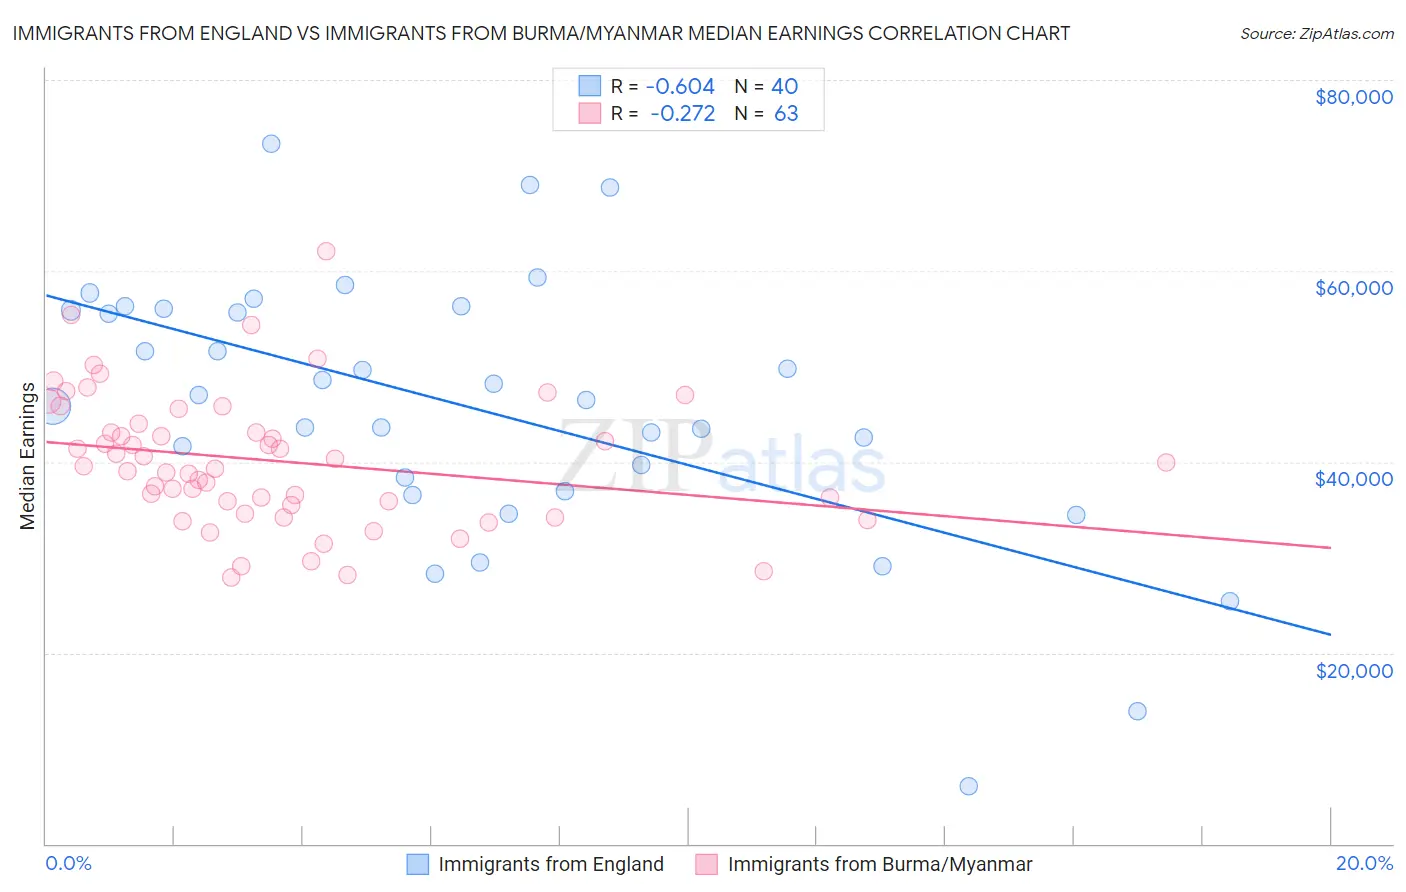
Immigrants from England vs Immigrants from Burma/Myanmar Median Earnings Correlation Chart
The statistical analysis conducted on geographies consisting of 391,848,083 people shows a significant negative correlation between the proportion of Immigrants from England and median earnings in the United States with a correlation coefficient (R) of -0.604 and weighted average of $49,722. Similarly, the statistical analysis conducted on geographies consisting of 172,362,577 people shows a weak negative correlation between the proportion of Immigrants from Burma/Myanmar and median earnings in the United States with a correlation coefficient (R) of -0.272 and weighted average of $43,998, a difference of 13.0%.
Median Earnings Correlation Summary
| Measurement | Immigrants from England | Immigrants from Burma/Myanmar |
| Minimum | $5,997 | $27,898 |
| Maximum | $73,280 | $62,054 |
| Range | $67,283 | $34,156 |
| Mean | $45,709 | $40,087 |
| Median | $46,726 | $39,569 |
| Interquartile 25% (IQ1) | $37,678 | $35,543 |
| Interquartile 75% (IQ3) | $55,979 | $44,022 |
| Interquartile Range (IQR) | $18,301 | $8,479 |
| Standard Deviation (Sample) | $13,949 | $6,933 |
| Standard Deviation (Population) | $13,773 | $6,878 |
Similar Demographics by Median Earnings
Demographics Similar to Immigrants from England by Median Earnings
In terms of median earnings, the demographic groups most similar to Immigrants from England are Croatian ($49,724, a difference of 0.0%), Immigrants from Lebanon ($49,682, a difference of 0.080%), Immigrants from North Macedonia ($49,658, a difference of 0.13%), Immigrants from Northern Africa ($49,648, a difference of 0.15%), and Armenian ($49,804, a difference of 0.16%).
| Demographics | Rating | Rank | Median Earnings |
| Albanians | 99.4 /100 | #88 | Exceptional $50,116 |
| Immigrants | North America | 99.4 /100 | #89 | Exceptional $50,108 |
| Italians | 99.3 /100 | #90 | Exceptional $49,915 |
| Macedonians | 99.2 /100 | #91 | Exceptional $49,893 |
| Immigrants | Argentina | 99.2 /100 | #92 | Exceptional $49,841 |
| Armenians | 99.1 /100 | #93 | Exceptional $49,804 |
| Croatians | 99.0 /100 | #94 | Exceptional $49,724 |
| Immigrants | England | 99.0 /100 | #95 | Exceptional $49,722 |
| Immigrants | Lebanon | 99.0 /100 | #96 | Exceptional $49,682 |
| Immigrants | North Macedonia | 98.9 /100 | #97 | Exceptional $49,658 |
| Immigrants | Northern Africa | 98.9 /100 | #98 | Exceptional $49,648 |
| Immigrants | Afghanistan | 98.9 /100 | #99 | Exceptional $49,645 |
| Immigrants | Poland | 98.9 /100 | #100 | Exceptional $49,633 |
| Jordanians | 98.9 /100 | #101 | Exceptional $49,632 |
| Ethiopians | 98.8 /100 | #102 | Exceptional $49,572 |
Demographics Similar to Immigrants from Burma/Myanmar by Median Earnings
In terms of median earnings, the demographic groups most similar to Immigrants from Burma/Myanmar are Immigrants from West Indies ($43,989, a difference of 0.020%), Immigrants from Cabo Verde ($43,963, a difference of 0.080%), Subsaharan African ($44,118, a difference of 0.27%), Nonimmigrants ($44,117, a difference of 0.27%), and Nepalese ($43,860, a difference of 0.31%).
| Demographics | Rating | Rank | Median Earnings |
| Sudanese | 5.6 /100 | #238 | Tragic $44,419 |
| Senegalese | 5.3 /100 | #239 | Tragic $44,373 |
| Aleuts | 4.4 /100 | #240 | Tragic $44,241 |
| Samoans | 4.2 /100 | #241 | Tragic $44,206 |
| Immigrants | Venezuela | 4.0 /100 | #242 | Tragic $44,163 |
| Sub-Saharan Africans | 3.7 /100 | #243 | Tragic $44,118 |
| Immigrants | Nonimmigrants | 3.7 /100 | #244 | Tragic $44,117 |
| Immigrants | Burma/Myanmar | 3.2 /100 | #245 | Tragic $43,998 |
| Immigrants | West Indies | 3.1 /100 | #246 | Tragic $43,989 |
| Immigrants | Cabo Verde | 3.0 /100 | #247 | Tragic $43,963 |
| Nepalese | 2.6 /100 | #248 | Tragic $43,860 |
| Malaysians | 2.6 /100 | #249 | Tragic $43,844 |
| Alaska Natives | 2.3 /100 | #250 | Tragic $43,750 |
| Tsimshian | 2.1 /100 | #251 | Tragic $43,695 |
| Hawaiians | 2.0 /100 | #252 | Tragic $43,673 |