Native Hawaiian vs Immigrants from Moldova Median Earnings
COMPARE
Native Hawaiian
Immigrants from Moldova
Median Earnings
Median Earnings Comparison
Native Hawaiians
Immigrants from Moldova
$45,027
MEDIAN EARNINGS
12.2/ 100
METRIC RATING
227th/ 347
METRIC RANK
$50,274
MEDIAN EARNINGS
99.5/ 100
METRIC RATING
82nd/ 347
METRIC RANK
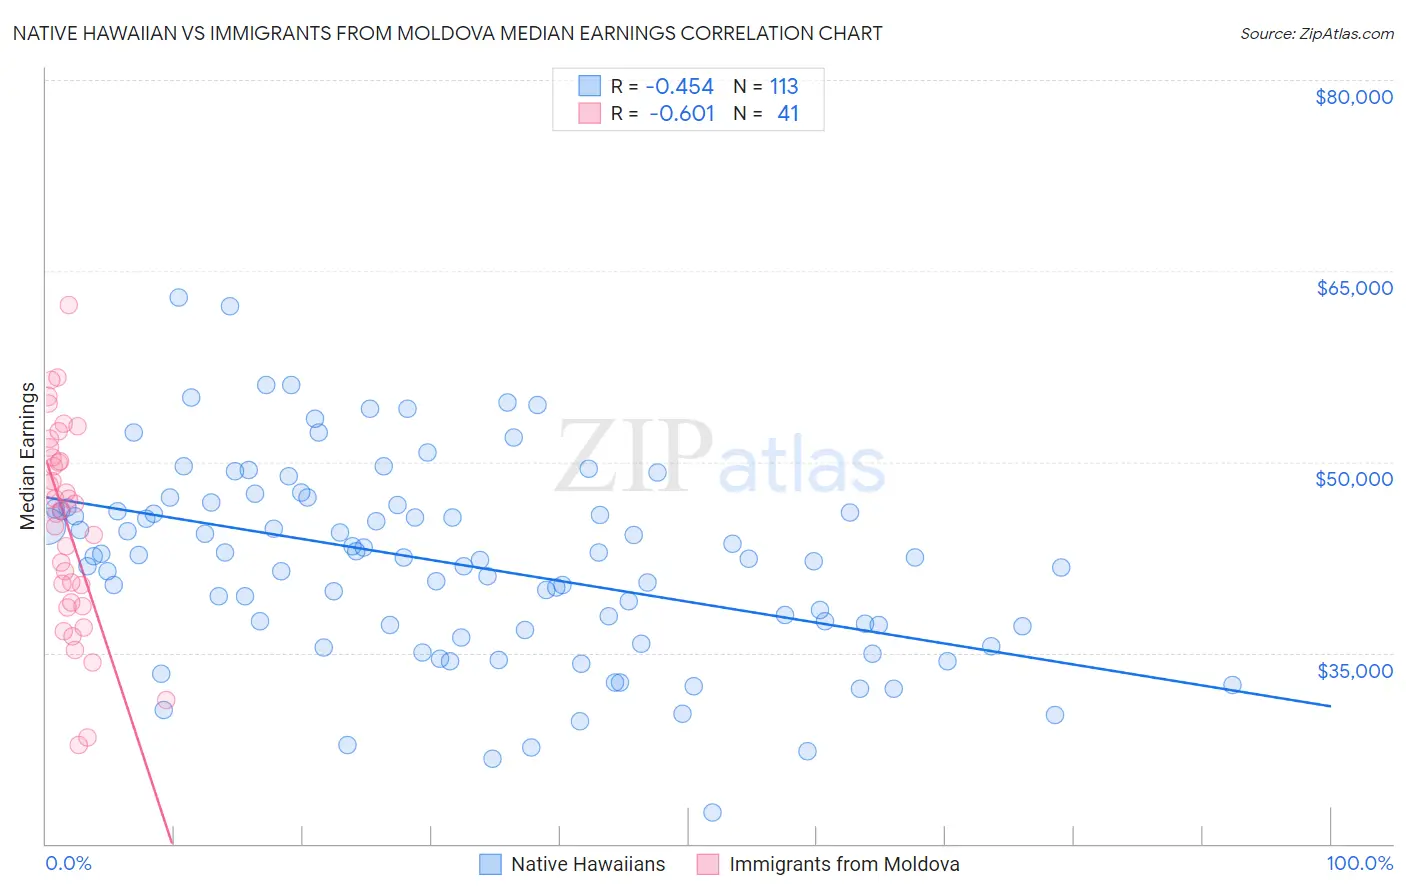
Native Hawaiian vs Immigrants from Moldova Median Earnings Correlation Chart
The statistical analysis conducted on geographies consisting of 332,103,903 people shows a moderate negative correlation between the proportion of Native Hawaiians and median earnings in the United States with a correlation coefficient (R) of -0.454 and weighted average of $45,027. Similarly, the statistical analysis conducted on geographies consisting of 124,398,835 people shows a significant negative correlation between the proportion of Immigrants from Moldova and median earnings in the United States with a correlation coefficient (R) of -0.601 and weighted average of $50,274, a difference of 11.7%.
Median Earnings Correlation Summary
| Measurement | Native Hawaiian | Immigrants from Moldova |
| Minimum | $22,468 | $27,768 |
| Maximum | $62,910 | $62,360 |
| Range | $40,442 | $34,592 |
| Mean | $42,021 | $44,970 |
| Median | $42,485 | $46,266 |
| Interquartile 25% (IQ1) | $36,941 | $38,796 |
| Interquartile 75% (IQ3) | $46,349 | $50,724 |
| Interquartile Range (IQR) | $9,407 | $11,928 |
| Standard Deviation (Sample) | $7,647 | $7,997 |
| Standard Deviation (Population) | $7,613 | $7,899 |
Similar Demographics by Median Earnings
Demographics Similar to Native Hawaiians by Median Earnings
In terms of median earnings, the demographic groups most similar to Native Hawaiians are Immigrants from Nigeria ($45,030, a difference of 0.010%), Immigrants from Iraq ($44,988, a difference of 0.090%), Immigrants from Cambodia ($45,090, a difference of 0.14%), West Indian ($45,132, a difference of 0.23%), and Scotch-Irish ($44,924, a difference of 0.23%).
| Demographics | Rating | Rank | Median Earnings |
| Ecuadorians | 15.3 /100 | #220 | Poor $45,214 |
| Immigrants | Guyana | 15.1 /100 | #221 | Poor $45,204 |
| Immigrants | Panama | 15.0 /100 | #222 | Poor $45,198 |
| Whites/Caucasians | 15.0 /100 | #223 | Poor $45,197 |
| West Indians | 13.9 /100 | #224 | Poor $45,132 |
| Immigrants | Cambodia | 13.2 /100 | #225 | Poor $45,090 |
| Immigrants | Nigeria | 12.2 /100 | #226 | Poor $45,030 |
| Native Hawaiians | 12.2 /100 | #227 | Poor $45,027 |
| Immigrants | Iraq | 11.6 /100 | #228 | Poor $44,988 |
| Scotch-Irish | 10.7 /100 | #229 | Poor $44,924 |
| Immigrants | Western Africa | 10.3 /100 | #230 | Poor $44,893 |
| Japanese | 9.5 /100 | #231 | Tragic $44,825 |
| Delaware | 9.0 /100 | #232 | Tragic $44,783 |
| Immigrants | Sudan | 8.8 /100 | #233 | Tragic $44,767 |
| Cape Verdeans | 7.5 /100 | #234 | Tragic $44,640 |
Demographics Similar to Immigrants from Moldova by Median Earnings
In terms of median earnings, the demographic groups most similar to Immigrants from Moldova are Immigrants from Southern Europe ($50,280, a difference of 0.010%), Romanian ($50,244, a difference of 0.060%), Ukrainian ($50,320, a difference of 0.090%), Immigrants from Hungary ($50,227, a difference of 0.090%), and Immigrants from Kazakhstan ($50,225, a difference of 0.10%).
| Demographics | Rating | Rank | Median Earnings |
| Immigrants | Scotland | 99.8 /100 | #75 | Exceptional $50,741 |
| Immigrants | Italy | 99.7 /100 | #76 | Exceptional $50,581 |
| Immigrants | Western Europe | 99.7 /100 | #77 | Exceptional $50,549 |
| Argentineans | 99.6 /100 | #78 | Exceptional $50,399 |
| Laotians | 99.6 /100 | #79 | Exceptional $50,343 |
| Ukrainians | 99.6 /100 | #80 | Exceptional $50,320 |
| Immigrants | Southern Europe | 99.6 /100 | #81 | Exceptional $50,280 |
| Immigrants | Moldova | 99.5 /100 | #82 | Exceptional $50,274 |
| Romanians | 99.5 /100 | #83 | Exceptional $50,244 |
| Immigrants | Hungary | 99.5 /100 | #84 | Exceptional $50,227 |
| Immigrants | Kazakhstan | 99.5 /100 | #85 | Exceptional $50,225 |
| Immigrants | Canada | 99.5 /100 | #86 | Exceptional $50,192 |
| Immigrants | Uzbekistan | 99.5 /100 | #87 | Exceptional $50,151 |
| Albanians | 99.4 /100 | #88 | Exceptional $50,116 |
| Immigrants | North America | 99.4 /100 | #89 | Exceptional $50,108 |