Native Hawaiian vs Yaqui Median Earnings
COMPARE
Native Hawaiian
Yaqui
Median Earnings
Median Earnings Comparison
Native Hawaiians
Yaqui
$45,027
MEDIAN EARNINGS
12.2/ 100
METRIC RATING
227th/ 347
METRIC RANK
$40,647
MEDIAN EARNINGS
0.0/ 100
METRIC RATING
306th/ 347
METRIC RANK
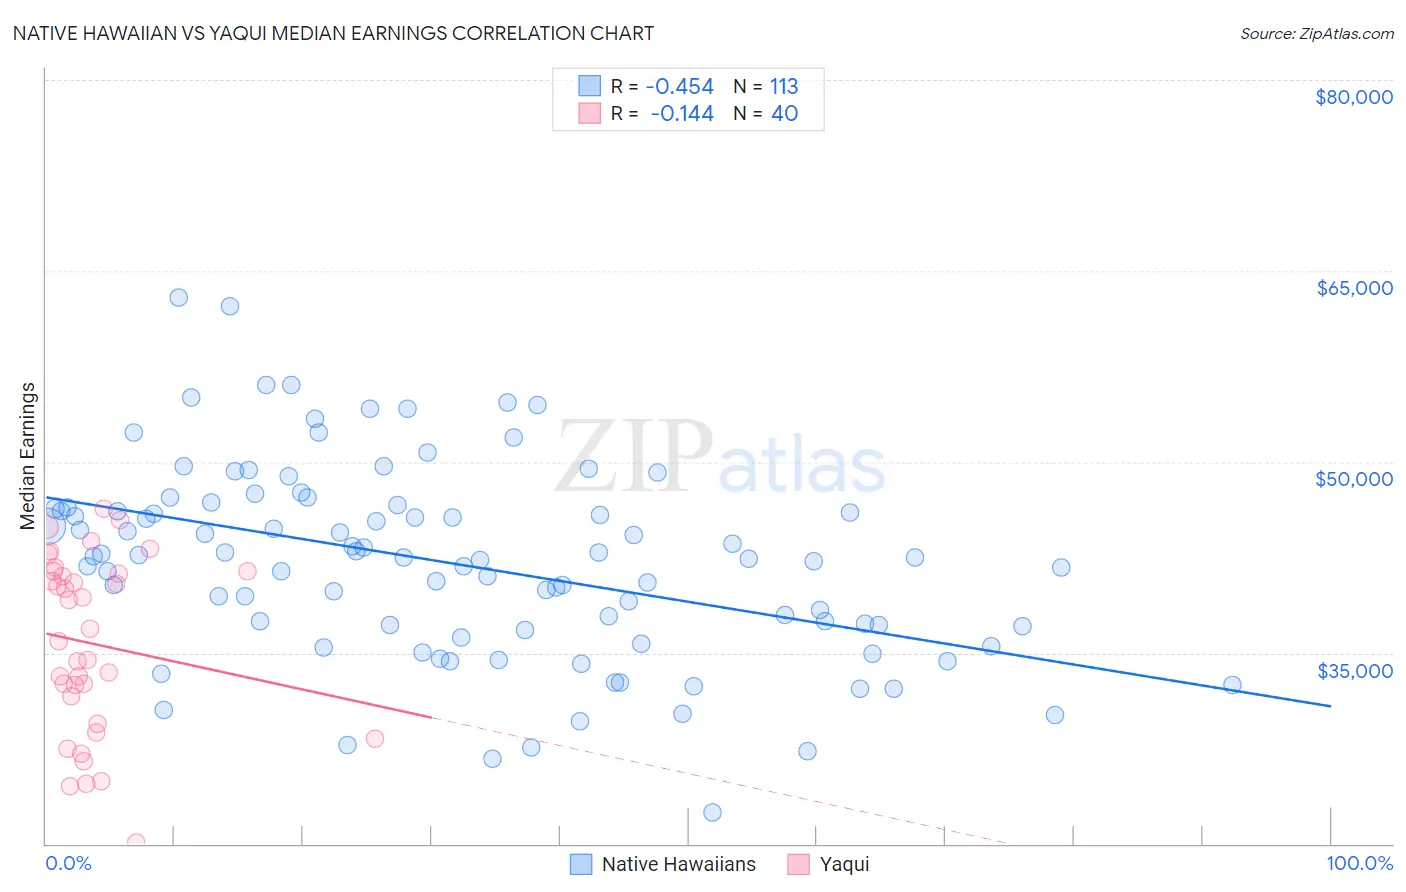
Native Hawaiian vs Yaqui Median Earnings Correlation Chart
The statistical analysis conducted on geographies consisting of 332,103,903 people shows a moderate negative correlation between the proportion of Native Hawaiians and median earnings in the United States with a correlation coefficient (R) of -0.454 and weighted average of $45,027. Similarly, the statistical analysis conducted on geographies consisting of 107,736,593 people shows a poor negative correlation between the proportion of Yaqui and median earnings in the United States with a correlation coefficient (R) of -0.144 and weighted average of $40,647, a difference of 10.8%.
Median Earnings Correlation Summary
| Measurement | Native Hawaiian | Yaqui |
| Minimum | $22,468 | $20,058 |
| Maximum | $62,910 | $46,273 |
| Range | $40,442 | $26,215 |
| Mean | $42,021 | $35,713 |
| Median | $42,485 | $36,396 |
| Interquartile 25% (IQ1) | $36,941 | $30,515 |
| Interquartile 75% (IQ3) | $46,349 | $41,344 |
| Interquartile Range (IQR) | $9,407 | $10,829 |
| Standard Deviation (Sample) | $7,647 | $6,900 |
| Standard Deviation (Population) | $7,613 | $6,813 |
Similar Demographics by Median Earnings
Demographics Similar to Native Hawaiians by Median Earnings
In terms of median earnings, the demographic groups most similar to Native Hawaiians are Immigrants from Nigeria ($45,030, a difference of 0.010%), Immigrants from Iraq ($44,988, a difference of 0.090%), Immigrants from Cambodia ($45,090, a difference of 0.14%), West Indian ($45,132, a difference of 0.23%), and Scotch-Irish ($44,924, a difference of 0.23%).
| Demographics | Rating | Rank | Median Earnings |
| Ecuadorians | 15.3 /100 | #220 | Poor $45,214 |
| Immigrants | Guyana | 15.1 /100 | #221 | Poor $45,204 |
| Immigrants | Panama | 15.0 /100 | #222 | Poor $45,198 |
| Whites/Caucasians | 15.0 /100 | #223 | Poor $45,197 |
| West Indians | 13.9 /100 | #224 | Poor $45,132 |
| Immigrants | Cambodia | 13.2 /100 | #225 | Poor $45,090 |
| Immigrants | Nigeria | 12.2 /100 | #226 | Poor $45,030 |
| Native Hawaiians | 12.2 /100 | #227 | Poor $45,027 |
| Immigrants | Iraq | 11.6 /100 | #228 | Poor $44,988 |
| Scotch-Irish | 10.7 /100 | #229 | Poor $44,924 |
| Immigrants | Western Africa | 10.3 /100 | #230 | Poor $44,893 |
| Japanese | 9.5 /100 | #231 | Tragic $44,825 |
| Delaware | 9.0 /100 | #232 | Tragic $44,783 |
| Immigrants | Sudan | 8.8 /100 | #233 | Tragic $44,767 |
| Cape Verdeans | 7.5 /100 | #234 | Tragic $44,640 |
Demographics Similar to Yaqui by Median Earnings
In terms of median earnings, the demographic groups most similar to Yaqui are Honduran ($40,638, a difference of 0.020%), Chickasaw ($40,672, a difference of 0.060%), Cuban ($40,619, a difference of 0.070%), Immigrants from Haiti ($40,550, a difference of 0.24%), and Immigrants from Guatemala ($40,851, a difference of 0.50%).
| Demographics | Rating | Rank | Median Earnings |
| Immigrants | Caribbean | 0.1 /100 | #299 | Tragic $41,119 |
| Ute | 0.1 /100 | #300 | Tragic $41,051 |
| Immigrants | Latin America | 0.1 /100 | #301 | Tragic $41,049 |
| Shoshone | 0.0 /100 | #302 | Tragic $40,932 |
| Haitians | 0.0 /100 | #303 | Tragic $40,918 |
| Immigrants | Guatemala | 0.0 /100 | #304 | Tragic $40,851 |
| Chickasaw | 0.0 /100 | #305 | Tragic $40,672 |
| Yaqui | 0.0 /100 | #306 | Tragic $40,647 |
| Hondurans | 0.0 /100 | #307 | Tragic $40,638 |
| Cubans | 0.0 /100 | #308 | Tragic $40,619 |
| Immigrants | Haiti | 0.0 /100 | #309 | Tragic $40,550 |
| Apache | 0.0 /100 | #310 | Tragic $40,388 |
| Hispanics or Latinos | 0.0 /100 | #311 | Tragic $40,288 |
| Chippewa | 0.0 /100 | #312 | Tragic $40,287 |
| Choctaw | 0.0 /100 | #313 | Tragic $40,270 |