Native Hawaiian vs Immigrants from Poland Median Earnings
COMPARE
Native Hawaiian
Immigrants from Poland
Median Earnings
Median Earnings Comparison
Native Hawaiians
Immigrants from Poland
$45,027
MEDIAN EARNINGS
12.2/ 100
METRIC RATING
227th/ 347
METRIC RANK
$49,633
MEDIAN EARNINGS
98.9/ 100
METRIC RATING
100th/ 347
METRIC RANK
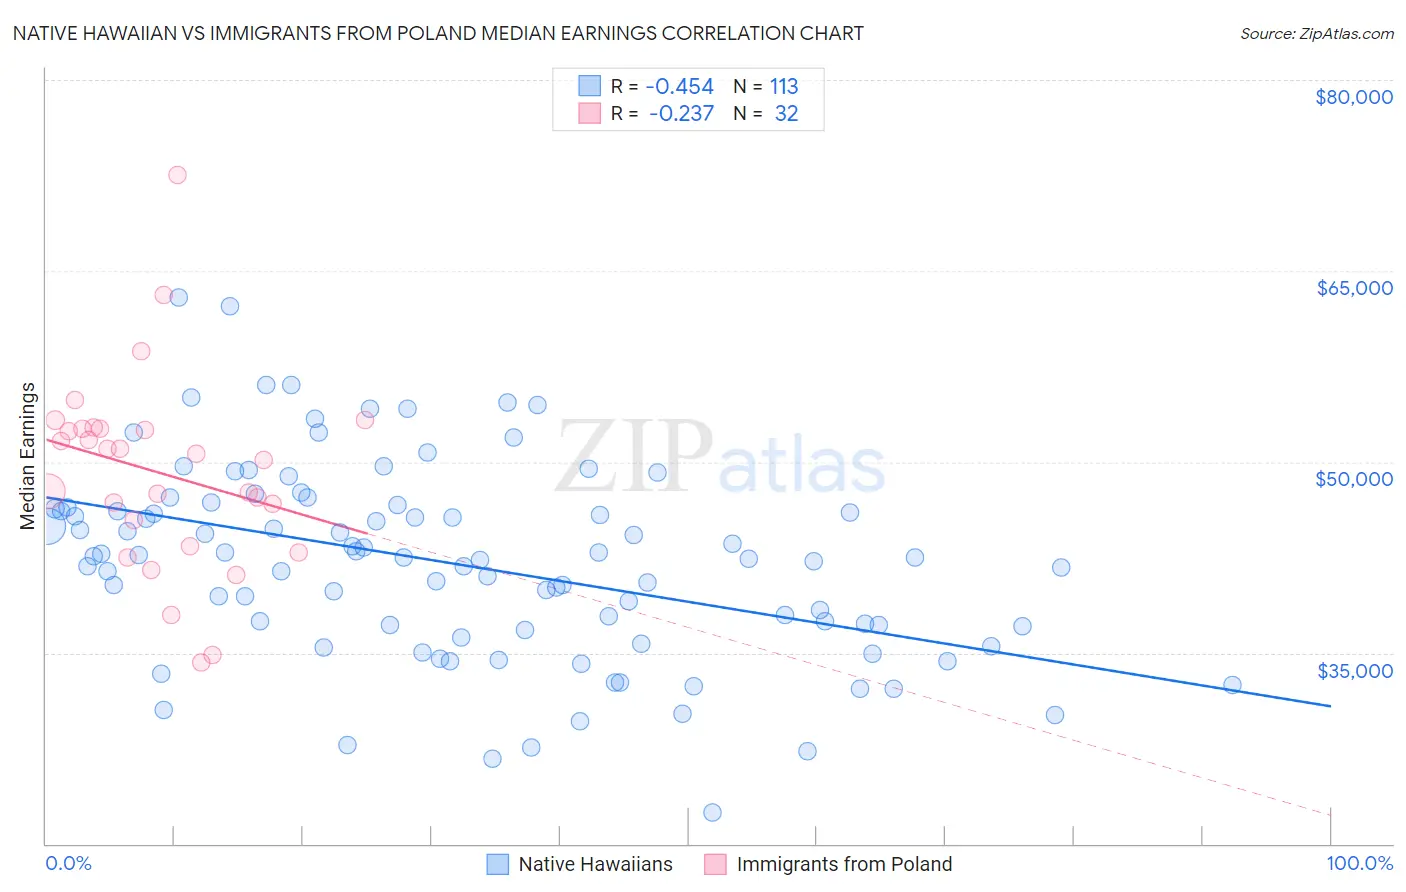
Native Hawaiian vs Immigrants from Poland Median Earnings Correlation Chart
The statistical analysis conducted on geographies consisting of 332,103,903 people shows a moderate negative correlation between the proportion of Native Hawaiians and median earnings in the United States with a correlation coefficient (R) of -0.454 and weighted average of $45,027. Similarly, the statistical analysis conducted on geographies consisting of 304,849,071 people shows a weak negative correlation between the proportion of Immigrants from Poland and median earnings in the United States with a correlation coefficient (R) of -0.237 and weighted average of $49,633, a difference of 10.2%.
Median Earnings Correlation Summary
| Measurement | Native Hawaiian | Immigrants from Poland |
| Minimum | $22,468 | $34,220 |
| Maximum | $62,910 | $72,500 |
| Range | $40,442 | $38,280 |
| Mean | $42,021 | $49,130 |
| Median | $42,485 | $50,398 |
| Interquartile 25% (IQ1) | $36,941 | $44,359 |
| Interquartile 75% (IQ3) | $46,349 | $52,592 |
| Interquartile Range (IQR) | $9,407 | $8,233 |
| Standard Deviation (Sample) | $7,647 | $7,639 |
| Standard Deviation (Population) | $7,613 | $7,518 |
Similar Demographics by Median Earnings
Demographics Similar to Native Hawaiians by Median Earnings
In terms of median earnings, the demographic groups most similar to Native Hawaiians are Immigrants from Nigeria ($45,030, a difference of 0.010%), Immigrants from Iraq ($44,988, a difference of 0.090%), Immigrants from Cambodia ($45,090, a difference of 0.14%), West Indian ($45,132, a difference of 0.23%), and Scotch-Irish ($44,924, a difference of 0.23%).
| Demographics | Rating | Rank | Median Earnings |
| Ecuadorians | 15.3 /100 | #220 | Poor $45,214 |
| Immigrants | Guyana | 15.1 /100 | #221 | Poor $45,204 |
| Immigrants | Panama | 15.0 /100 | #222 | Poor $45,198 |
| Whites/Caucasians | 15.0 /100 | #223 | Poor $45,197 |
| West Indians | 13.9 /100 | #224 | Poor $45,132 |
| Immigrants | Cambodia | 13.2 /100 | #225 | Poor $45,090 |
| Immigrants | Nigeria | 12.2 /100 | #226 | Poor $45,030 |
| Native Hawaiians | 12.2 /100 | #227 | Poor $45,027 |
| Immigrants | Iraq | 11.6 /100 | #228 | Poor $44,988 |
| Scotch-Irish | 10.7 /100 | #229 | Poor $44,924 |
| Immigrants | Western Africa | 10.3 /100 | #230 | Poor $44,893 |
| Japanese | 9.5 /100 | #231 | Tragic $44,825 |
| Delaware | 9.0 /100 | #232 | Tragic $44,783 |
| Immigrants | Sudan | 8.8 /100 | #233 | Tragic $44,767 |
| Cape Verdeans | 7.5 /100 | #234 | Tragic $44,640 |
Demographics Similar to Immigrants from Poland by Median Earnings
In terms of median earnings, the demographic groups most similar to Immigrants from Poland are Jordanian ($49,632, a difference of 0.0%), Immigrants from Afghanistan ($49,645, a difference of 0.020%), Immigrants from Northern Africa ($49,648, a difference of 0.030%), Immigrants from North Macedonia ($49,658, a difference of 0.050%), and Immigrants from Lebanon ($49,682, a difference of 0.10%).
| Demographics | Rating | Rank | Median Earnings |
| Armenians | 99.1 /100 | #93 | Exceptional $49,804 |
| Croatians | 99.0 /100 | #94 | Exceptional $49,724 |
| Immigrants | England | 99.0 /100 | #95 | Exceptional $49,722 |
| Immigrants | Lebanon | 99.0 /100 | #96 | Exceptional $49,682 |
| Immigrants | North Macedonia | 98.9 /100 | #97 | Exceptional $49,658 |
| Immigrants | Northern Africa | 98.9 /100 | #98 | Exceptional $49,648 |
| Immigrants | Afghanistan | 98.9 /100 | #99 | Exceptional $49,645 |
| Immigrants | Poland | 98.9 /100 | #100 | Exceptional $49,633 |
| Jordanians | 98.9 /100 | #101 | Exceptional $49,632 |
| Ethiopians | 98.8 /100 | #102 | Exceptional $49,572 |
| Austrians | 98.7 /100 | #103 | Exceptional $49,501 |
| Immigrants | Brazil | 98.6 /100 | #104 | Exceptional $49,463 |
| Immigrants | Western Asia | 98.4 /100 | #105 | Exceptional $49,389 |
| Immigrants | Albania | 98.4 /100 | #106 | Exceptional $49,377 |
| Immigrants | Morocco | 98.4 /100 | #107 | Exceptional $49,368 |