Mongolian vs Immigrants from Cabo Verde Wage/Income Gap
COMPARE
Mongolian
Immigrants from Cabo Verde
Wage/Income Gap
Wage/Income Gap Comparison
Mongolians
Immigrants from Cabo Verde
26.6%
WAGE/INCOME GAP
11.4/ 100
METRIC RATING
211th/ 347
METRIC RANK
23.6%
WAGE/INCOME GAP
99.5/ 100
METRIC RATING
93rd/ 347
METRIC RANK
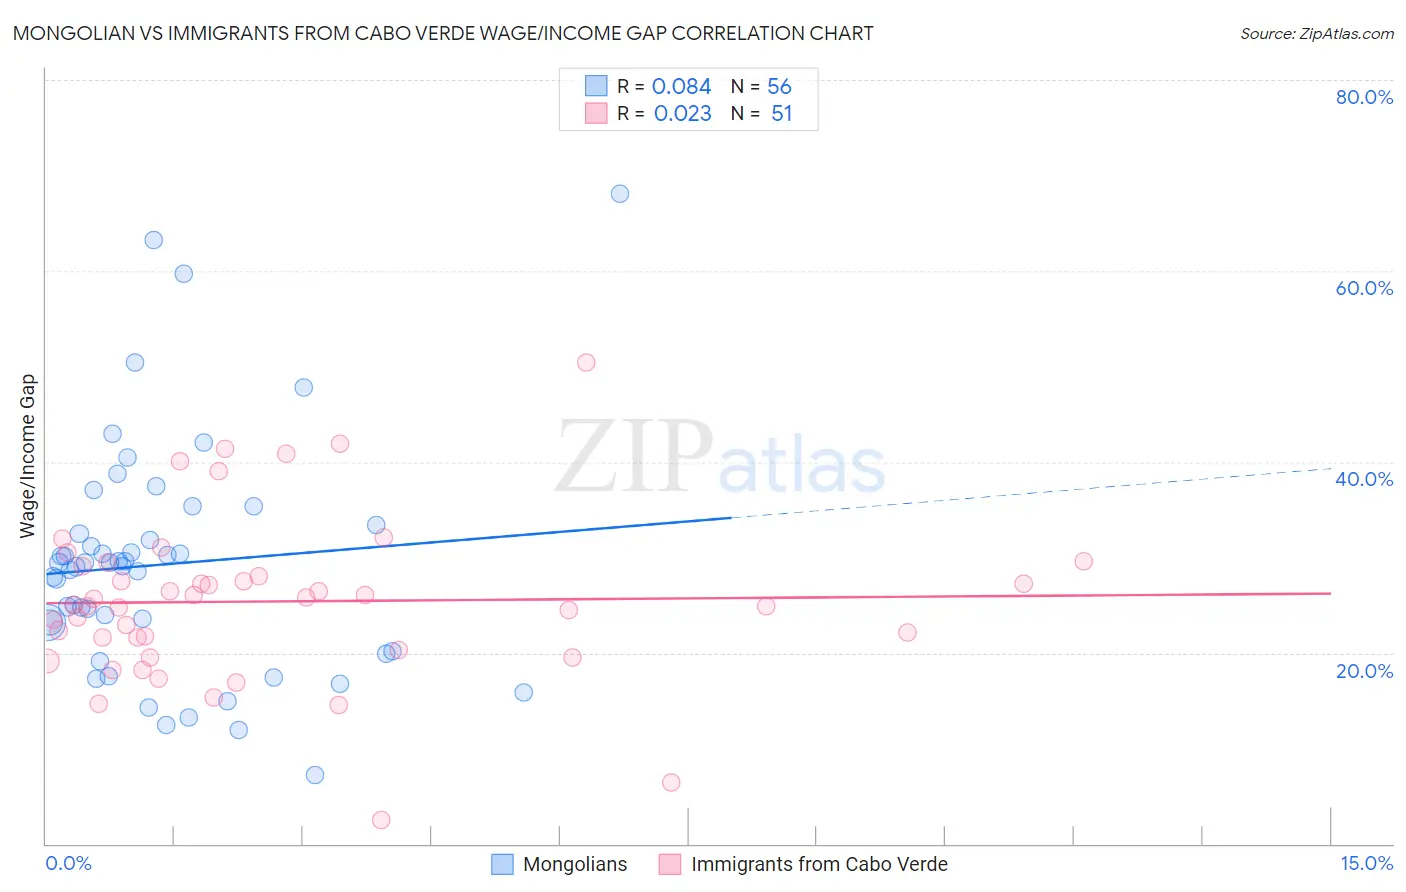
Mongolian vs Immigrants from Cabo Verde Wage/Income Gap Correlation Chart
The statistical analysis conducted on geographies consisting of 140,332,926 people shows a slight positive correlation between the proportion of Mongolians and wage/income gap percentage in the United States with a correlation coefficient (R) of 0.084 and weighted average of 26.6%. Similarly, the statistical analysis conducted on geographies consisting of 38,157,799 people shows no correlation between the proportion of Immigrants from Cabo Verde and wage/income gap percentage in the United States with a correlation coefficient (R) of 0.023 and weighted average of 23.6%, a difference of 13.0%.
Wage/Income Gap Correlation Summary
| Measurement | Mongolian | Immigrants from Cabo Verde |
| Minimum | 7.3% | 2.5% |
| Maximum | 68.0% | 50.5% |
| Range | 60.8% | 48.0% |
| Mean | 29.3% | 25.4% |
| Median | 29.2% | 25.0% |
| Interquartile 25% (IQ1) | 21.7% | 20.3% |
| Interquartile 75% (IQ3) | 32.9% | 29.1% |
| Interquartile Range (IQR) | 11.2% | 8.8% |
| Standard Deviation (Sample) | 12.2% | 8.6% |
| Standard Deviation (Population) | 12.1% | 8.5% |
Similar Demographics by Wage/Income Gap
Demographics Similar to Mongolians by Wage/Income Gap
In terms of wage/income gap, the demographic groups most similar to Mongolians are Iraqi (26.6%, a difference of 0.030%), Arab (26.6%, a difference of 0.13%), Immigrants from Kuwait (26.6%, a difference of 0.17%), Immigrants from Iraq (26.7%, a difference of 0.18%), and Egyptian (26.6%, a difference of 0.19%).
| Demographics | Rating | Rank | Wage/Income Gap |
| Immigrants | Russia | 19.0 /100 | #204 | Poor 26.4% |
| Immigrants | Southern Europe | 17.3 /100 | #205 | Poor 26.4% |
| Indians (Asian) | 16.5 /100 | #206 | Poor 26.4% |
| Immigrants | Italy | 15.8 /100 | #207 | Poor 26.5% |
| Egyptians | 12.7 /100 | #208 | Poor 26.6% |
| Immigrants | Kuwait | 12.6 /100 | #209 | Poor 26.6% |
| Arabs | 12.3 /100 | #210 | Poor 26.6% |
| Mongolians | 11.4 /100 | #211 | Poor 26.6% |
| Iraqis | 11.2 /100 | #212 | Poor 26.6% |
| Immigrants | Iraq | 10.3 /100 | #213 | Poor 26.7% |
| Immigrants | China | 10.3 /100 | #214 | Poor 26.7% |
| Yugoslavians | 9.7 /100 | #215 | Tragic 26.7% |
| Immigrants | Portugal | 9.5 /100 | #216 | Tragic 26.7% |
| Brazilians | 9.2 /100 | #217 | Tragic 26.7% |
| Immigrants | Saudi Arabia | 9.1 /100 | #218 | Tragic 26.7% |
Demographics Similar to Immigrants from Cabo Verde by Wage/Income Gap
In terms of wage/income gap, the demographic groups most similar to Immigrants from Cabo Verde are Honduran (23.6%, a difference of 0.090%), Cape Verdean (23.6%, a difference of 0.12%), Immigrants from Honduras (23.5%, a difference of 0.24%), Kiowa (23.6%, a difference of 0.24%), and Immigrants from Sudan (23.6%, a difference of 0.33%).
| Demographics | Rating | Rank | Wage/Income Gap |
| Cheyenne | 99.7 /100 | #86 | Exceptional 23.3% |
| Yuman | 99.7 /100 | #87 | Exceptional 23.3% |
| Immigrants | Panama | 99.6 /100 | #88 | Exceptional 23.4% |
| Marshallese | 99.6 /100 | #89 | Exceptional 23.4% |
| Nicaraguans | 99.6 /100 | #90 | Exceptional 23.4% |
| Arapaho | 99.6 /100 | #91 | Exceptional 23.5% |
| Immigrants | Honduras | 99.5 /100 | #92 | Exceptional 23.5% |
| Immigrants | Cabo Verde | 99.5 /100 | #93 | Exceptional 23.6% |
| Hondurans | 99.5 /100 | #94 | Exceptional 23.6% |
| Cape Verdeans | 99.4 /100 | #95 | Exceptional 23.6% |
| Kiowa | 99.4 /100 | #96 | Exceptional 23.6% |
| Immigrants | Sudan | 99.4 /100 | #97 | Exceptional 23.6% |
| Immigrants | Latin America | 99.2 /100 | #98 | Exceptional 23.7% |
| Aleuts | 99.2 /100 | #99 | Exceptional 23.7% |
| Yakama | 99.2 /100 | #100 | Exceptional 23.7% |