Mongolian vs Immigrants from Cabo Verde Female Unemployment
COMPARE
Mongolian
Immigrants from Cabo Verde
Female Unemployment
Female Unemployment Comparison
Mongolians
Immigrants from Cabo Verde
5.0%
FEMALE UNEMPLOYMENT
97.8/ 100
METRIC RATING
77th/ 347
METRIC RANK
6.1%
FEMALE UNEMPLOYMENT
0.0/ 100
METRIC RATING
285th/ 347
METRIC RANK
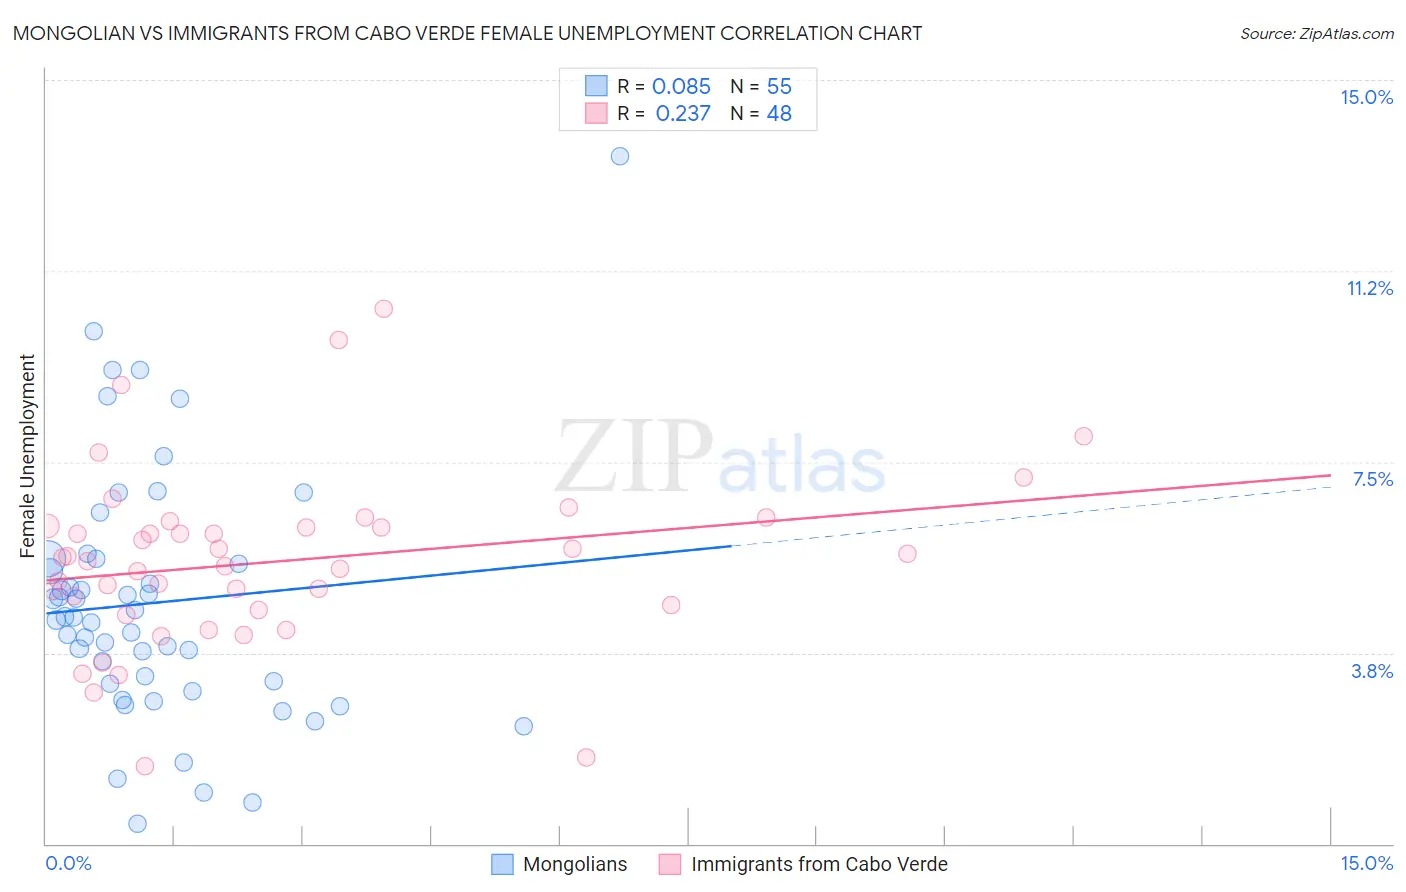
Mongolian vs Immigrants from Cabo Verde Female Unemployment Correlation Chart
The statistical analysis conducted on geographies consisting of 140,252,025 people shows a slight positive correlation between the proportion of Mongolians and unemploymnet rate among females in the United States with a correlation coefficient (R) of 0.085 and weighted average of 5.0%. Similarly, the statistical analysis conducted on geographies consisting of 38,081,993 people shows a weak positive correlation between the proportion of Immigrants from Cabo Verde and unemploymnet rate among females in the United States with a correlation coefficient (R) of 0.237 and weighted average of 6.1%, a difference of 22.7%.
Female Unemployment Correlation Summary
| Measurement | Mongolian | Immigrants from Cabo Verde |
| Minimum | 0.40% | 1.5% |
| Maximum | 13.5% | 10.5% |
| Range | 13.1% | 9.0% |
| Mean | 4.7% | 5.5% |
| Median | 4.4% | 5.6% |
| Interquartile 25% (IQ1) | 3.1% | 4.7% |
| Interquartile 75% (IQ3) | 5.6% | 6.2% |
| Interquartile Range (IQR) | 2.5% | 1.6% |
| Standard Deviation (Sample) | 2.5% | 1.7% |
| Standard Deviation (Population) | 2.4% | 1.7% |
Similar Demographics by Female Unemployment
Demographics Similar to Mongolians by Female Unemployment
In terms of female unemployment, the demographic groups most similar to Mongolians are Immigrants from Netherlands (5.0%, a difference of 0.0%), Immigrants from Venezuela (5.0%, a difference of 0.090%), Immigrants from Singapore (5.0%, a difference of 0.10%), Immigrants from Bolivia (5.0%, a difference of 0.12%), and Russian (5.0%, a difference of 0.13%).
| Demographics | Rating | Rank | Female Unemployment |
| Osage | 98.2 /100 | #70 | Exceptional 4.9% |
| German Russians | 98.1 /100 | #71 | Exceptional 4.9% |
| Immigrants | Northern Europe | 98.0 /100 | #72 | Exceptional 4.9% |
| Russians | 98.0 /100 | #73 | Exceptional 5.0% |
| Immigrants | Bolivia | 98.0 /100 | #74 | Exceptional 5.0% |
| Immigrants | Singapore | 98.0 /100 | #75 | Exceptional 5.0% |
| Immigrants | Venezuela | 97.9 /100 | #76 | Exceptional 5.0% |
| Mongolians | 97.8 /100 | #77 | Exceptional 5.0% |
| Immigrants | Netherlands | 97.8 /100 | #78 | Exceptional 5.0% |
| Turks | 97.6 /100 | #79 | Exceptional 5.0% |
| New Zealanders | 97.4 /100 | #80 | Exceptional 5.0% |
| Filipinos | 97.3 /100 | #81 | Exceptional 5.0% |
| Immigrants | Australia | 97.3 /100 | #82 | Exceptional 5.0% |
| Immigrants | Serbia | 97.2 /100 | #83 | Exceptional 5.0% |
| Canadians | 97.2 /100 | #84 | Exceptional 5.0% |
Demographics Similar to Immigrants from Cabo Verde by Female Unemployment
In terms of female unemployment, the demographic groups most similar to Immigrants from Cabo Verde are Chippewa (6.1%, a difference of 0.030%), Immigrants from Guatemala (6.1%, a difference of 0.050%), Haitian (6.1%, a difference of 0.10%), Trinidadian and Tobagonian (6.1%, a difference of 0.11%), and Immigrants from Caribbean (6.1%, a difference of 0.17%).
| Demographics | Rating | Rank | Female Unemployment |
| Yaqui | 0.0 /100 | #278 | Tragic 6.0% |
| Armenians | 0.0 /100 | #279 | Tragic 6.0% |
| Mexican American Indians | 0.0 /100 | #280 | Tragic 6.0% |
| Guatemalans | 0.0 /100 | #281 | Tragic 6.0% |
| Colville | 0.0 /100 | #282 | Tragic 6.0% |
| Salvadorans | 0.0 /100 | #283 | Tragic 6.0% |
| Immigrants | Senegal | 0.0 /100 | #284 | Tragic 6.1% |
| Immigrants | Cabo Verde | 0.0 /100 | #285 | Tragic 6.1% |
| Chippewa | 0.0 /100 | #286 | Tragic 6.1% |
| Immigrants | Guatemala | 0.0 /100 | #287 | Tragic 6.1% |
| Haitians | 0.0 /100 | #288 | Tragic 6.1% |
| Trinidadians and Tobagonians | 0.0 /100 | #289 | Tragic 6.1% |
| Immigrants | Caribbean | 0.0 /100 | #290 | Tragic 6.1% |
| Immigrants | West Indies | 0.0 /100 | #291 | Tragic 6.1% |
| Immigrants | Trinidad and Tobago | 0.0 /100 | #292 | Tragic 6.1% |