Ugandan vs Immigrants from Cabo Verde Wage/Income Gap
COMPARE
Ugandan
Immigrants from Cabo Verde
Wage/Income Gap
Wage/Income Gap Comparison
Ugandans
Immigrants from Cabo Verde
24.1%
WAGE/INCOME GAP
98.3/ 100
METRIC RATING
109th/ 347
METRIC RANK
23.6%
WAGE/INCOME GAP
99.5/ 100
METRIC RATING
93rd/ 347
METRIC RANK
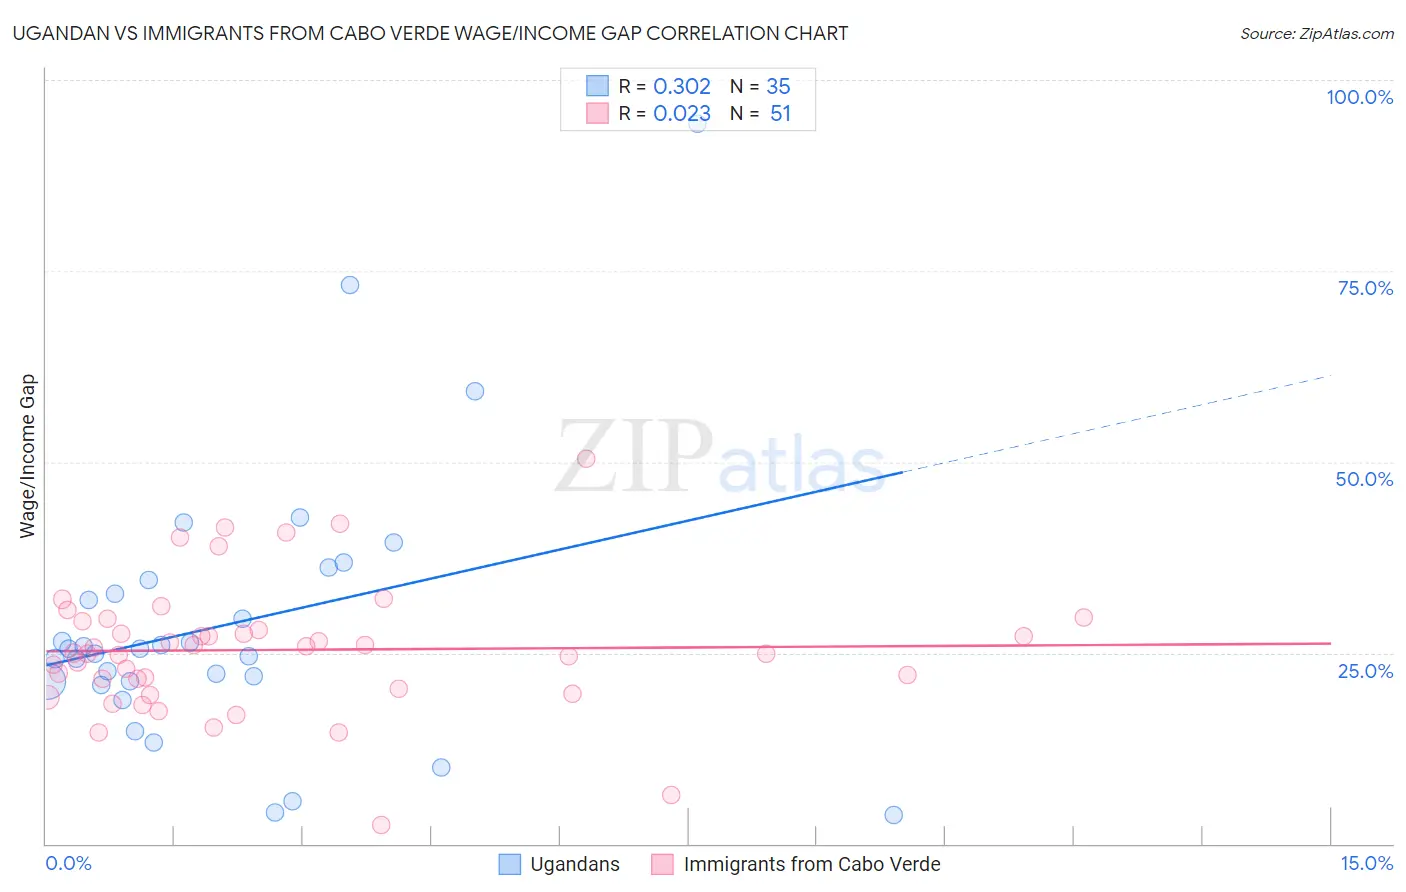
Ugandan vs Immigrants from Cabo Verde Wage/Income Gap Correlation Chart
The statistical analysis conducted on geographies consisting of 94,009,821 people shows a mild positive correlation between the proportion of Ugandans and wage/income gap percentage in the United States with a correlation coefficient (R) of 0.302 and weighted average of 24.1%. Similarly, the statistical analysis conducted on geographies consisting of 38,157,799 people shows no correlation between the proportion of Immigrants from Cabo Verde and wage/income gap percentage in the United States with a correlation coefficient (R) of 0.023 and weighted average of 23.6%, a difference of 2.1%.
Wage/Income Gap Correlation Summary
| Measurement | Ugandan | Immigrants from Cabo Verde |
| Minimum | 3.7% | 2.5% |
| Maximum | 94.2% | 50.5% |
| Range | 90.5% | 48.0% |
| Mean | 28.8% | 25.4% |
| Median | 25.5% | 25.0% |
| Interquartile 25% (IQ1) | 21.3% | 20.3% |
| Interquartile 75% (IQ3) | 34.5% | 29.1% |
| Interquartile Range (IQR) | 13.3% | 8.8% |
| Standard Deviation (Sample) | 17.9% | 8.6% |
| Standard Deviation (Population) | 17.7% | 8.5% |
Demographics Similar to Ugandans and Immigrants from Cabo Verde by Wage/Income Gap
In terms of wage/income gap, the demographic groups most similar to Ugandans are Yaqui (24.0%, a difference of 0.060%), Immigrants from Albania (24.0%, a difference of 0.060%), Immigrants from Morocco (24.1%, a difference of 0.22%), Sudanese (24.0%, a difference of 0.36%), and Moroccan (24.0%, a difference of 0.37%). Similarly, the demographic groups most similar to Immigrants from Cabo Verde are Honduran (23.6%, a difference of 0.090%), Cape Verdean (23.6%, a difference of 0.12%), Immigrants from Honduras (23.5%, a difference of 0.24%), Kiowa (23.6%, a difference of 0.24%), and Immigrants from Sudan (23.6%, a difference of 0.33%).
| Demographics | Rating | Rank | Wage/Income Gap |
| Arapaho | 99.6 /100 | #91 | Exceptional 23.5% |
| Immigrants | Honduras | 99.5 /100 | #92 | Exceptional 23.5% |
| Immigrants | Cabo Verde | 99.5 /100 | #93 | Exceptional 23.6% |
| Hondurans | 99.5 /100 | #94 | Exceptional 23.6% |
| Cape Verdeans | 99.4 /100 | #95 | Exceptional 23.6% |
| Kiowa | 99.4 /100 | #96 | Exceptional 23.6% |
| Immigrants | Sudan | 99.4 /100 | #97 | Exceptional 23.6% |
| Immigrants | Latin America | 99.2 /100 | #98 | Exceptional 23.7% |
| Aleuts | 99.2 /100 | #99 | Exceptional 23.7% |
| Yakama | 99.2 /100 | #100 | Exceptional 23.7% |
| Japanese | 99.1 /100 | #101 | Exceptional 23.8% |
| Immigrants | Laos | 99.0 /100 | #102 | Exceptional 23.8% |
| Tsimshian | 98.9 /100 | #103 | Exceptional 23.9% |
| Tlingit-Haida | 98.7 /100 | #104 | Exceptional 24.0% |
| Moroccans | 98.6 /100 | #105 | Exceptional 24.0% |
| Sudanese | 98.6 /100 | #106 | Exceptional 24.0% |
| Yaqui | 98.4 /100 | #107 | Exceptional 24.0% |
| Immigrants | Albania | 98.4 /100 | #108 | Exceptional 24.0% |
| Ugandans | 98.3 /100 | #109 | Exceptional 24.1% |
| Immigrants | Morocco | 98.1 /100 | #110 | Exceptional 24.1% |
| Soviet Union | 97.6 /100 | #111 | Exceptional 24.2% |