Lumbee vs British West Indian Median Household Income
COMPARE
Lumbee
British West Indian
Median Household Income
Median Household Income Comparison
Lumbee
British West Indians
$54,644
MEDIAN HOUSEHOLD INCOME
0.0/ 100
METRIC RATING
347th/ 347
METRIC RANK
$75,647
MEDIAN HOUSEHOLD INCOME
0.2/ 100
METRIC RATING
274th/ 347
METRIC RANK
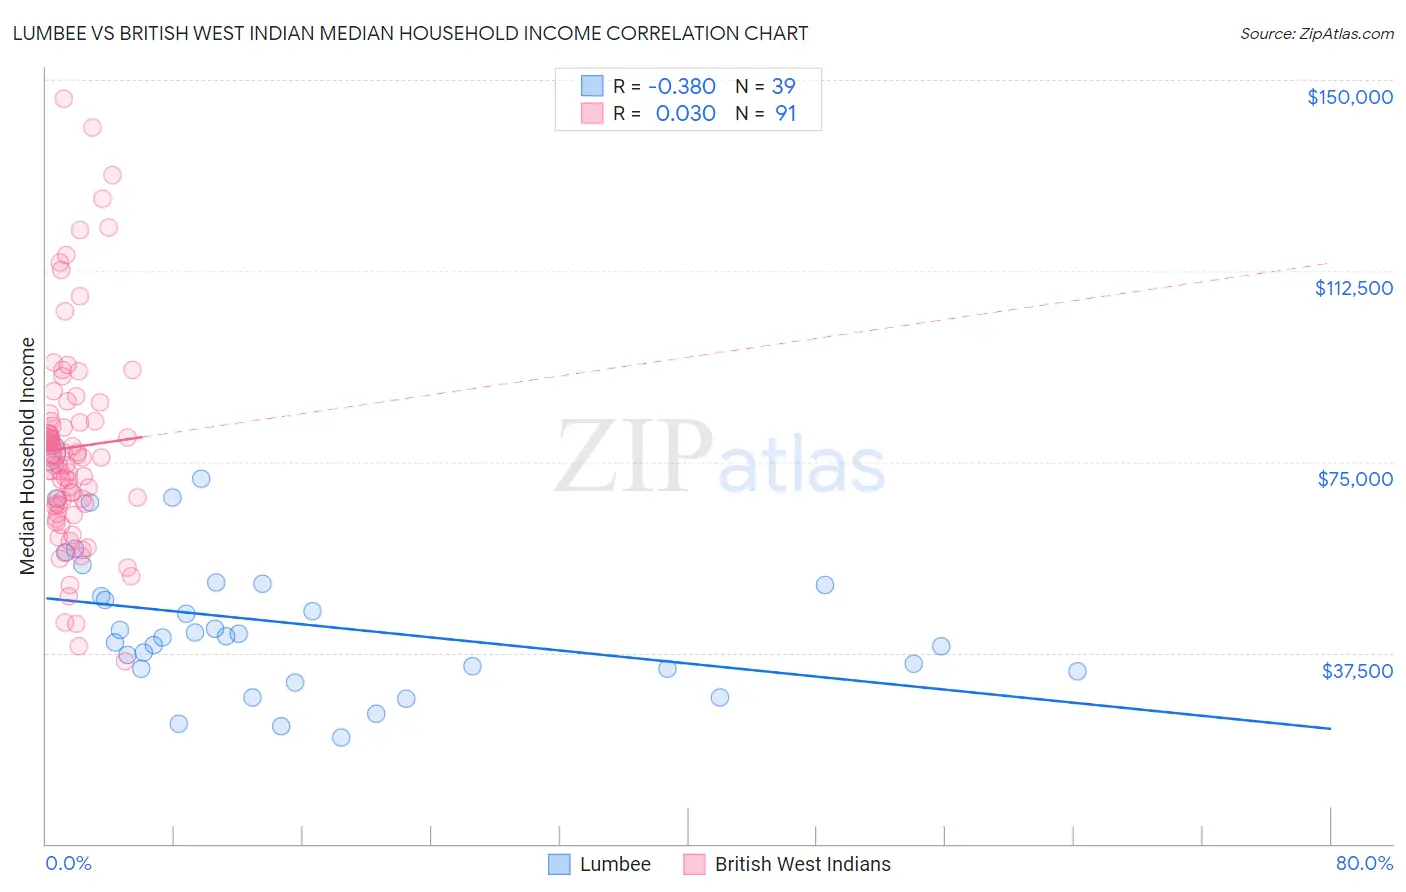
Lumbee vs British West Indian Median Household Income Correlation Chart
The statistical analysis conducted on geographies consisting of 92,249,872 people shows a mild negative correlation between the proportion of Lumbee and median household income in the United States with a correlation coefficient (R) of -0.380 and weighted average of $54,644. Similarly, the statistical analysis conducted on geographies consisting of 152,617,098 people shows no correlation between the proportion of British West Indians and median household income in the United States with a correlation coefficient (R) of 0.030 and weighted average of $75,647, a difference of 38.4%.
Median Household Income Correlation Summary
| Measurement | Lumbee | British West Indian |
| Minimum | $20,917 | $35,840 |
| Maximum | $76,919 | $146,303 |
| Range | $56,002 | $110,463 |
| Mean | $43,208 | $77,834 |
| Median | $40,857 | $75,947 |
| Interquartile 25% (IQ1) | $34,279 | $66,444 |
| Interquartile 75% (IQ3) | $51,174 | $83,003 |
| Interquartile Range (IQR) | $16,895 | $16,558 |
| Standard Deviation (Sample) | $13,998 | $20,857 |
| Standard Deviation (Population) | $13,817 | $20,742 |
Similar Demographics by Median Household Income
Demographics Similar to Lumbee by Median Household Income
In terms of median household income, the demographic groups most similar to Lumbee are Navajo ($59,159, a difference of 8.3%), Puerto Rican ($59,197, a difference of 8.3%), Tohono O'odham ($61,663, a difference of 12.8%), Houma ($62,575, a difference of 14.5%), and Pima ($63,262, a difference of 15.8%).
| Demographics | Rating | Rank | Median Household Income |
| Creek | 0.0 /100 | #333 | Tragic $67,715 |
| Blacks/African Americans | 0.0 /100 | #334 | Tragic $67,573 |
| Cheyenne | 0.0 /100 | #335 | Tragic $66,974 |
| Immigrants | Congo | 0.0 /100 | #336 | Tragic $66,768 |
| Kiowa | 0.0 /100 | #337 | Tragic $65,914 |
| Immigrants | Yemen | 0.0 /100 | #338 | Tragic $65,194 |
| Hopi | 0.0 /100 | #339 | Tragic $65,043 |
| Pueblo | 0.0 /100 | #340 | Tragic $64,692 |
| Crow | 0.0 /100 | #341 | Tragic $63,681 |
| Pima | 0.0 /100 | #342 | Tragic $63,262 |
| Houma | 0.0 /100 | #343 | Tragic $62,575 |
| Tohono O'odham | 0.0 /100 | #344 | Tragic $61,663 |
| Puerto Ricans | 0.0 /100 | #345 | Tragic $59,197 |
| Navajo | 0.0 /100 | #346 | Tragic $59,159 |
| Lumbee | 0.0 /100 | #347 | Tragic $54,644 |
Demographics Similar to British West Indians by Median Household Income
In terms of median household income, the demographic groups most similar to British West Indians are Liberian ($75,667, a difference of 0.030%), Immigrants from Micronesia ($75,574, a difference of 0.10%), Somali ($75,782, a difference of 0.18%), Pennsylvania German ($75,814, a difference of 0.22%), and Hmong ($75,839, a difference of 0.25%).
| Demographics | Rating | Rank | Median Household Income |
| German Russians | 0.3 /100 | #267 | Tragic $75,856 |
| Immigrants | Jamaica | 0.3 /100 | #268 | Tragic $75,851 |
| Cape Verdeans | 0.3 /100 | #269 | Tragic $75,848 |
| Hmong | 0.3 /100 | #270 | Tragic $75,839 |
| Pennsylvania Germans | 0.3 /100 | #271 | Tragic $75,814 |
| Somalis | 0.3 /100 | #272 | Tragic $75,782 |
| Liberians | 0.2 /100 | #273 | Tragic $75,667 |
| British West Indians | 0.2 /100 | #274 | Tragic $75,647 |
| Immigrants | Micronesia | 0.2 /100 | #275 | Tragic $75,574 |
| Immigrants | Latin America | 0.2 /100 | #276 | Tragic $75,420 |
| Spanish Americans | 0.2 /100 | #277 | Tragic $75,386 |
| Osage | 0.2 /100 | #278 | Tragic $75,240 |
| Immigrants | Guatemala | 0.2 /100 | #279 | Tragic $75,123 |
| Senegalese | 0.2 /100 | #280 | Tragic $74,999 |
| Immigrants | Liberia | 0.1 /100 | #281 | Tragic $74,896 |