Hispanic or Latino vs British West Indian Median Household Income
COMPARE
Hispanic or Latino
British West Indian
Median Household Income
Median Household Income Comparison
Hispanics or Latinos
British West Indians
$73,823
MEDIAN HOUSEHOLD INCOME
0.1/ 100
METRIC RATING
291st/ 347
METRIC RANK
$75,647
MEDIAN HOUSEHOLD INCOME
0.2/ 100
METRIC RATING
274th/ 347
METRIC RANK
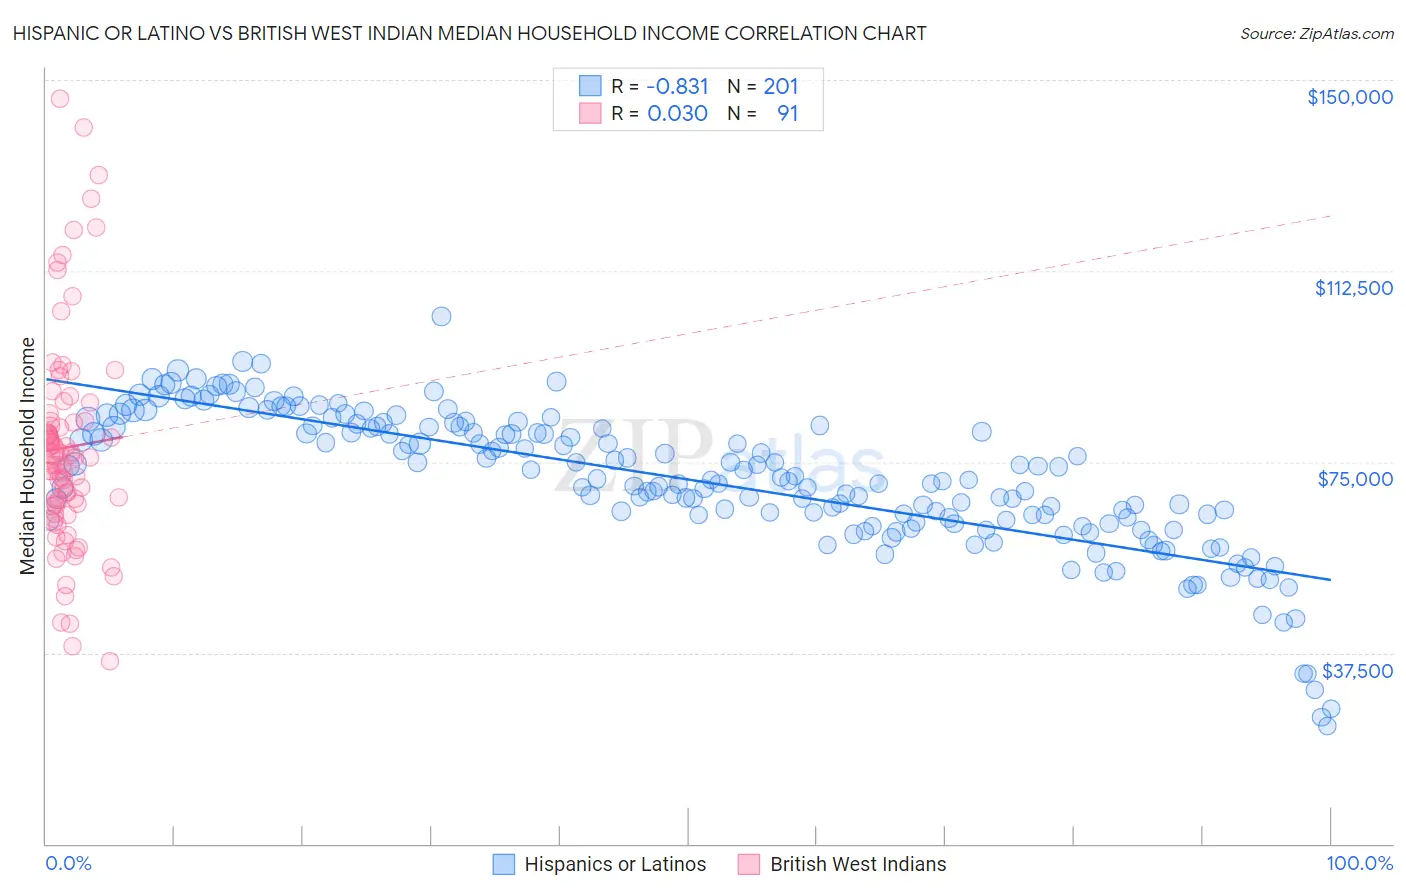
Hispanic or Latino vs British West Indian Median Household Income Correlation Chart
The statistical analysis conducted on geographies consisting of 577,204,907 people shows a very strong negative correlation between the proportion of Hispanics or Latinos and median household income in the United States with a correlation coefficient (R) of -0.831 and weighted average of $73,823. Similarly, the statistical analysis conducted on geographies consisting of 152,617,098 people shows no correlation between the proportion of British West Indians and median household income in the United States with a correlation coefficient (R) of 0.030 and weighted average of $75,647, a difference of 2.5%.
Median Household Income Correlation Summary
| Measurement | Hispanic or Latino | British West Indian |
| Minimum | $23,087 | $35,840 |
| Maximum | $103,536 | $146,303 |
| Range | $80,449 | $110,463 |
| Mean | $71,424 | $77,834 |
| Median | $71,562 | $75,947 |
| Interquartile 25% (IQ1) | $63,567 | $66,444 |
| Interquartile 75% (IQ3) | $81,961 | $83,003 |
| Interquartile Range (IQR) | $18,394 | $16,558 |
| Standard Deviation (Sample) | $13,788 | $20,857 |
| Standard Deviation (Population) | $13,754 | $20,742 |
Demographics Similar to Hispanics or Latinos and British West Indians by Median Household Income
In terms of median household income, the demographic groups most similar to Hispanics or Latinos are Comanche ($73,747, a difference of 0.10%), Bangladeshi ($74,112, a difference of 0.39%), Fijian ($74,205, a difference of 0.52%), Immigrants from Central America ($74,217, a difference of 0.53%), and Iroquois ($74,279, a difference of 0.62%). Similarly, the demographic groups most similar to British West Indians are Liberian ($75,667, a difference of 0.030%), Immigrants from Micronesia ($75,574, a difference of 0.10%), Somali ($75,782, a difference of 0.18%), Immigrants from Latin America ($75,420, a difference of 0.30%), and Spanish American ($75,386, a difference of 0.35%).
| Demographics | Rating | Rank | Median Household Income |
| Somalis | 0.3 /100 | #272 | Tragic $75,782 |
| Liberians | 0.2 /100 | #273 | Tragic $75,667 |
| British West Indians | 0.2 /100 | #274 | Tragic $75,647 |
| Immigrants | Micronesia | 0.2 /100 | #275 | Tragic $75,574 |
| Immigrants | Latin America | 0.2 /100 | #276 | Tragic $75,420 |
| Spanish Americans | 0.2 /100 | #277 | Tragic $75,386 |
| Osage | 0.2 /100 | #278 | Tragic $75,240 |
| Immigrants | Guatemala | 0.2 /100 | #279 | Tragic $75,123 |
| Senegalese | 0.2 /100 | #280 | Tragic $74,999 |
| Immigrants | Liberia | 0.1 /100 | #281 | Tragic $74,896 |
| Central American Indians | 0.1 /100 | #282 | Tragic $74,847 |
| Cree | 0.1 /100 | #283 | Tragic $74,685 |
| Yaqui | 0.1 /100 | #284 | Tragic $74,596 |
| Mexicans | 0.1 /100 | #285 | Tragic $74,399 |
| Immigrants | Somalia | 0.1 /100 | #286 | Tragic $74,300 |
| Iroquois | 0.1 /100 | #287 | Tragic $74,279 |
| Immigrants | Central America | 0.1 /100 | #288 | Tragic $74,217 |
| Fijians | 0.1 /100 | #289 | Tragic $74,205 |
| Bangladeshis | 0.1 /100 | #290 | Tragic $74,112 |
| Hispanics or Latinos | 0.1 /100 | #291 | Tragic $73,823 |
| Comanche | 0.1 /100 | #292 | Tragic $73,747 |