Immigrants from Uganda vs British West Indian Median Household Income
COMPARE
Immigrants from Uganda
British West Indian
Median Household Income
Median Household Income Comparison
Immigrants from Uganda
British West Indians
$87,553
MEDIAN HOUSEHOLD INCOME
82.8/ 100
METRIC RATING
146th/ 347
METRIC RANK
$75,647
MEDIAN HOUSEHOLD INCOME
0.2/ 100
METRIC RATING
274th/ 347
METRIC RANK
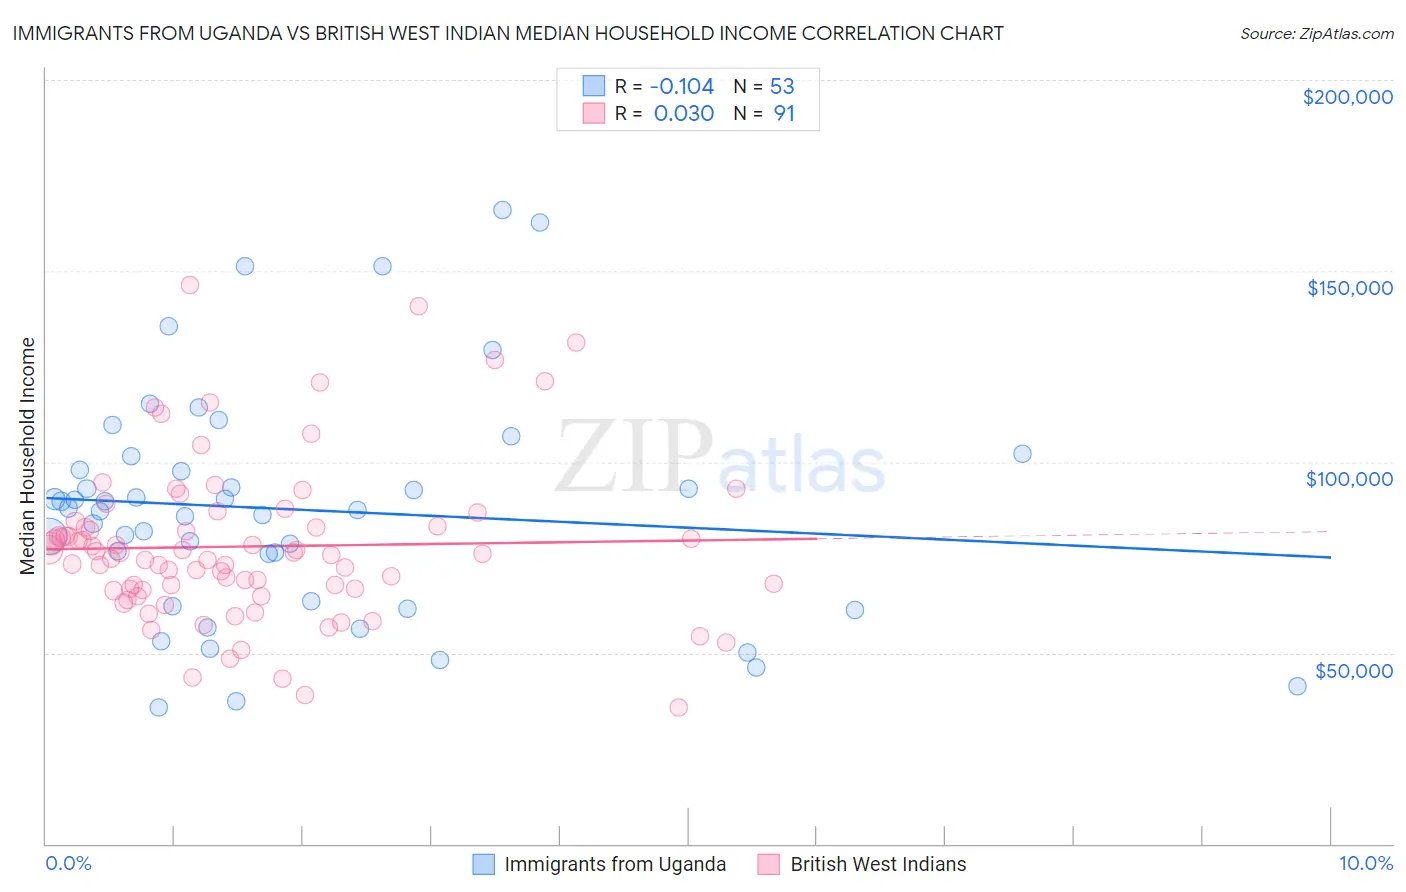
Immigrants from Uganda vs British West Indian Median Household Income Correlation Chart
The statistical analysis conducted on geographies consisting of 125,950,023 people shows a poor negative correlation between the proportion of Immigrants from Uganda and median household income in the United States with a correlation coefficient (R) of -0.104 and weighted average of $87,553. Similarly, the statistical analysis conducted on geographies consisting of 152,617,098 people shows no correlation between the proportion of British West Indians and median household income in the United States with a correlation coefficient (R) of 0.030 and weighted average of $75,647, a difference of 15.7%.
Median Household Income Correlation Summary
| Measurement | Immigrants from Uganda | British West Indian |
| Minimum | $35,519 | $35,840 |
| Maximum | $166,111 | $146,303 |
| Range | $130,592 | $110,463 |
| Mean | $87,480 | $77,834 |
| Median | $87,386 | $75,947 |
| Interquartile 25% (IQ1) | $62,932 | $66,444 |
| Interquartile 75% (IQ3) | $99,670 | $83,003 |
| Interquartile Range (IQR) | $36,738 | $16,558 |
| Standard Deviation (Sample) | $30,184 | $20,857 |
| Standard Deviation (Population) | $29,898 | $20,742 |
Similar Demographics by Median Household Income
Demographics Similar to Immigrants from Uganda by Median Household Income
In terms of median household income, the demographic groups most similar to Immigrants from Uganda are Ugandan ($87,557, a difference of 0.0%), Serbian ($87,572, a difference of 0.020%), South American Indian ($87,446, a difference of 0.12%), Danish ($87,676, a difference of 0.14%), and Canadian ($87,769, a difference of 0.25%).
| Demographics | Rating | Rank | Median Household Income |
| Immigrants | Chile | 89.2 /100 | #139 | Excellent $88,388 |
| Lebanese | 87.2 /100 | #140 | Excellent $88,091 |
| Immigrants | Morocco | 86.0 /100 | #141 | Excellent $87,930 |
| Canadians | 84.7 /100 | #142 | Excellent $87,769 |
| Danes | 83.9 /100 | #143 | Excellent $87,676 |
| Serbians | 83.0 /100 | #144 | Excellent $87,572 |
| Ugandans | 82.9 /100 | #145 | Excellent $87,557 |
| Immigrants | Uganda | 82.8 /100 | #146 | Excellent $87,553 |
| South American Indians | 81.8 /100 | #147 | Excellent $87,446 |
| Costa Ricans | 80.0 /100 | #148 | Excellent $87,262 |
| Immigrants | Nepal | 77.7 /100 | #149 | Good $87,046 |
| Basques | 77.2 /100 | #150 | Good $87,001 |
| Hungarians | 76.3 /100 | #151 | Good $86,920 |
| Immigrants | Saudi Arabia | 75.8 /100 | #152 | Good $86,875 |
| South Americans | 75.1 /100 | #153 | Good $86,824 |
Demographics Similar to British West Indians by Median Household Income
In terms of median household income, the demographic groups most similar to British West Indians are Liberian ($75,667, a difference of 0.030%), Immigrants from Micronesia ($75,574, a difference of 0.10%), Somali ($75,782, a difference of 0.18%), Pennsylvania German ($75,814, a difference of 0.22%), and Hmong ($75,839, a difference of 0.25%).
| Demographics | Rating | Rank | Median Household Income |
| German Russians | 0.3 /100 | #267 | Tragic $75,856 |
| Immigrants | Jamaica | 0.3 /100 | #268 | Tragic $75,851 |
| Cape Verdeans | 0.3 /100 | #269 | Tragic $75,848 |
| Hmong | 0.3 /100 | #270 | Tragic $75,839 |
| Pennsylvania Germans | 0.3 /100 | #271 | Tragic $75,814 |
| Somalis | 0.3 /100 | #272 | Tragic $75,782 |
| Liberians | 0.2 /100 | #273 | Tragic $75,667 |
| British West Indians | 0.2 /100 | #274 | Tragic $75,647 |
| Immigrants | Micronesia | 0.2 /100 | #275 | Tragic $75,574 |
| Immigrants | Latin America | 0.2 /100 | #276 | Tragic $75,420 |
| Spanish Americans | 0.2 /100 | #277 | Tragic $75,386 |
| Osage | 0.2 /100 | #278 | Tragic $75,240 |
| Immigrants | Guatemala | 0.2 /100 | #279 | Tragic $75,123 |
| Senegalese | 0.2 /100 | #280 | Tragic $74,999 |
| Immigrants | Liberia | 0.1 /100 | #281 | Tragic $74,896 |