Lumbee vs Trinidadian and Tobagonian Median Household Income
COMPARE
Lumbee
Trinidadian and Tobagonian
Median Household Income
Median Household Income Comparison
Lumbee
Trinidadians and Tobagonians
$54,644
MEDIAN HOUSEHOLD INCOME
0.0/ 100
METRIC RATING
347th/ 347
METRIC RANK
$80,402
MEDIAN HOUSEHOLD INCOME
4.7/ 100
METRIC RATING
231st/ 347
METRIC RANK
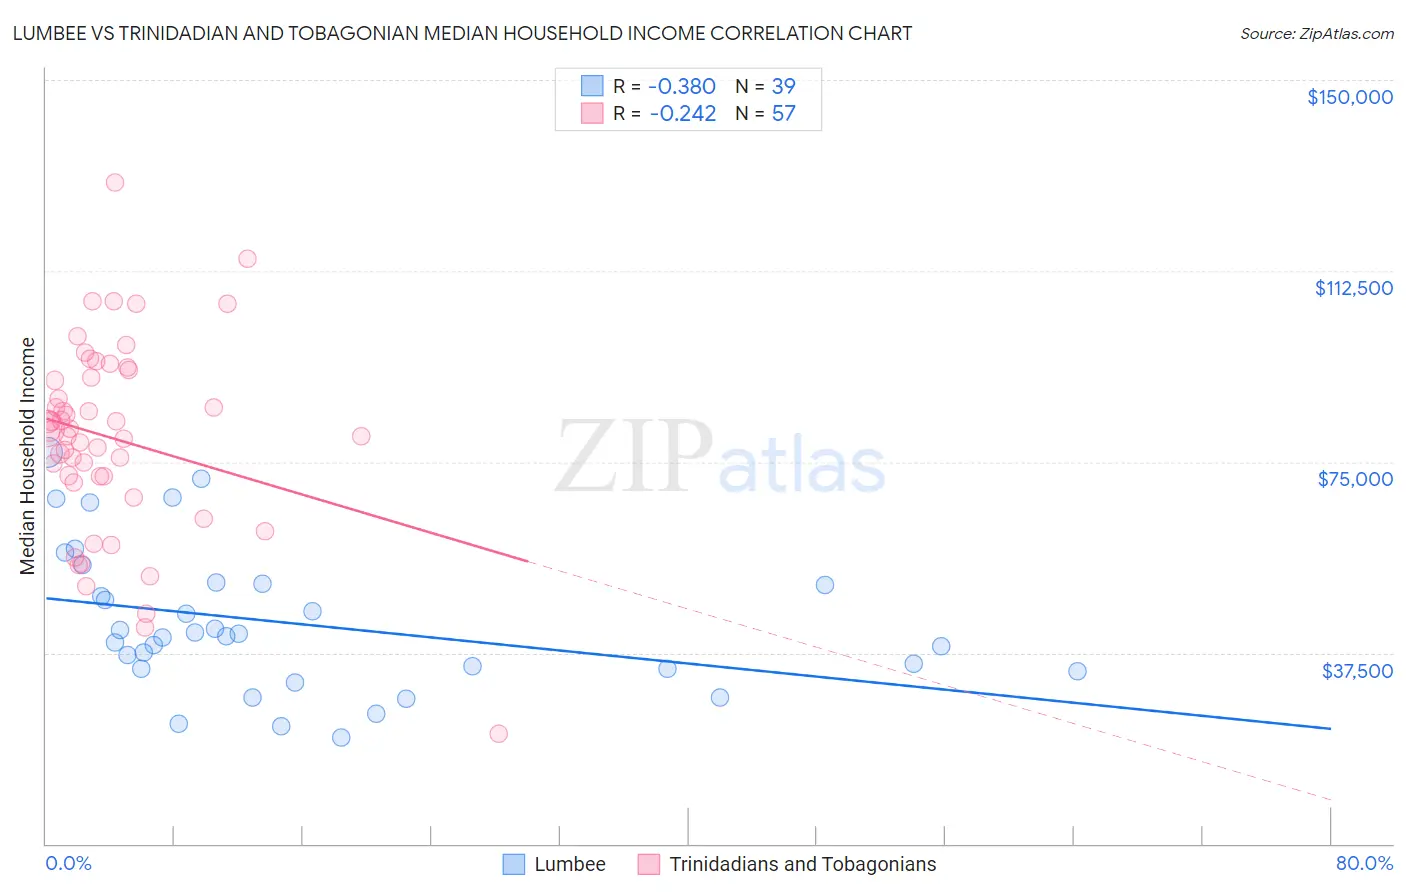
Lumbee vs Trinidadian and Tobagonian Median Household Income Correlation Chart
The statistical analysis conducted on geographies consisting of 92,249,872 people shows a mild negative correlation between the proportion of Lumbee and median household income in the United States with a correlation coefficient (R) of -0.380 and weighted average of $54,644. Similarly, the statistical analysis conducted on geographies consisting of 219,662,857 people shows a weak negative correlation between the proportion of Trinidadians and Tobagonians and median household income in the United States with a correlation coefficient (R) of -0.242 and weighted average of $80,402, a difference of 47.1%.
Median Household Income Correlation Summary
| Measurement | Lumbee | Trinidadian and Tobagonian |
| Minimum | $20,917 | $21,629 |
| Maximum | $76,919 | $129,829 |
| Range | $56,002 | $108,200 |
| Mean | $43,208 | $79,550 |
| Median | $40,857 | $80,957 |
| Interquartile 25% (IQ1) | $34,279 | $71,474 |
| Interquartile 75% (IQ3) | $51,174 | $92,337 |
| Interquartile Range (IQR) | $16,895 | $20,862 |
| Standard Deviation (Sample) | $13,998 | $19,105 |
| Standard Deviation (Population) | $13,817 | $18,937 |
Similar Demographics by Median Household Income
Demographics Similar to Lumbee by Median Household Income
In terms of median household income, the demographic groups most similar to Lumbee are Navajo ($59,159, a difference of 8.3%), Puerto Rican ($59,197, a difference of 8.3%), Tohono O'odham ($61,663, a difference of 12.8%), Houma ($62,575, a difference of 14.5%), and Pima ($63,262, a difference of 15.8%).
| Demographics | Rating | Rank | Median Household Income |
| Creek | 0.0 /100 | #333 | Tragic $67,715 |
| Blacks/African Americans | 0.0 /100 | #334 | Tragic $67,573 |
| Cheyenne | 0.0 /100 | #335 | Tragic $66,974 |
| Immigrants | Congo | 0.0 /100 | #336 | Tragic $66,768 |
| Kiowa | 0.0 /100 | #337 | Tragic $65,914 |
| Immigrants | Yemen | 0.0 /100 | #338 | Tragic $65,194 |
| Hopi | 0.0 /100 | #339 | Tragic $65,043 |
| Pueblo | 0.0 /100 | #340 | Tragic $64,692 |
| Crow | 0.0 /100 | #341 | Tragic $63,681 |
| Pima | 0.0 /100 | #342 | Tragic $63,262 |
| Houma | 0.0 /100 | #343 | Tragic $62,575 |
| Tohono O'odham | 0.0 /100 | #344 | Tragic $61,663 |
| Puerto Ricans | 0.0 /100 | #345 | Tragic $59,197 |
| Navajo | 0.0 /100 | #346 | Tragic $59,159 |
| Lumbee | 0.0 /100 | #347 | Tragic $54,644 |
Demographics Similar to Trinidadians and Tobagonians by Median Household Income
In terms of median household income, the demographic groups most similar to Trinidadians and Tobagonians are Bermudan ($80,406, a difference of 0.010%), Immigrants from Trinidad and Tobago ($80,373, a difference of 0.040%), Immigrants from the Azores ($80,357, a difference of 0.060%), Immigrants from Ecuador ($80,341, a difference of 0.080%), and Immigrants from Guyana ($80,324, a difference of 0.10%).
| Demographics | Rating | Rank | Median Household Income |
| Malaysians | 7.0 /100 | #224 | Tragic $81,064 |
| Scotch-Irish | 6.6 /100 | #225 | Tragic $80,972 |
| Immigrants | Panama | 6.2 /100 | #226 | Tragic $80,873 |
| Guyanese | 5.7 /100 | #227 | Tragic $80,734 |
| Immigrants | Bangladesh | 5.7 /100 | #228 | Tragic $80,722 |
| Delaware | 5.0 /100 | #229 | Tragic $80,527 |
| Bermudans | 4.7 /100 | #230 | Tragic $80,406 |
| Trinidadians and Tobagonians | 4.7 /100 | #231 | Tragic $80,402 |
| Immigrants | Trinidad and Tobago | 4.6 /100 | #232 | Tragic $80,373 |
| Immigrants | Azores | 4.5 /100 | #233 | Tragic $80,357 |
| Immigrants | Ecuador | 4.5 /100 | #234 | Tragic $80,341 |
| Immigrants | Guyana | 4.5 /100 | #235 | Tragic $80,324 |
| Immigrants | Bosnia and Herzegovina | 3.4 /100 | #236 | Tragic $79,888 |
| Nicaraguans | 3.1 /100 | #237 | Tragic $79,737 |
| Barbadians | 3.0 /100 | #238 | Tragic $79,664 |